
Latest News
2022 Start working on a new website
BBS Trading Expert
Watch the Youtube BBS video and here is a crude oil trading example
Want to know more about:
AXIOM business books awards, bronze medal! Thank You!
No longer available!
Favorite articles in 2010, 11, 12, 14 and 2015 S&C Readers' Choice Awards.

AXIOM Business Books Awards, bronze medal.

Technical Analysis Price Projections Part 2
Fibonacci Studies
Leonardo Pisano Fibonacci was an Italian mathematician born in 1170. He was considered by some to be, “the most talented mathematician of the Middle Ages”.
In Liber Abaci (c. 1202), Fibonacci introduced the so-called modus Indorum (method of the Indians), which today is known as Hindu-Arabic numerals.
Liber Abaci also presented, and solved, a problem involving the growth of a hypothetical population of rabbits, which was based on idealized assumptions. The solution was a sequence of numbers that, over several generations, became known as Fibonacci numbers.
The number sequence was known to Indian mathematicians as early as the 6th century, but it was Fibonacci’s Liber Abaci that introduced it to the West.
Special offer: "Capturing Profit with technical Analysis"
Fibonacci numbers have the following sequence:
1, 1, 2, 3, 5, 8, 13, 21, 34, 55, 89, 144, 233, and so on. Each number is the sum of the two previous numbers. The higher up in the sequence, the closer two consecutive numbers of the sequence divided by each other will approach the golden ratio (approximately 1 : 1.618, or 0.618 : 1).
Fibonacci numbers, or patterns, are found in seashells, flower petals, sunflower seed heads, pinecones, palm fronds, pineapple rinds, and 90% of plant leaf and petal arrangements.
Fibonacci Levels
Charting Fibonacci levels is done by first drawing a fictive vertical line between two turning points that you wish to examine for Fibonacci levels.
Next you draw horizontals through retracement levels at 100%, 61.8% (100*0.618), 50%, 38.2% (61.8*0.618), 23.6% (38.2*0.618), and 0%; next horizontals at three or more Fibonacci target levels at 161.8% (100*1.618), 261.8% (161.8*1.618), and 423.6% (261.8*1.618). After the price moves up or down, there often will be a partial retracement, which will find support and resistance on Fibonacci levels.
Fibonacci Levels in an Uptrend
We use the chart of AMR Corp to show Fibonacci levels in an uptrend.
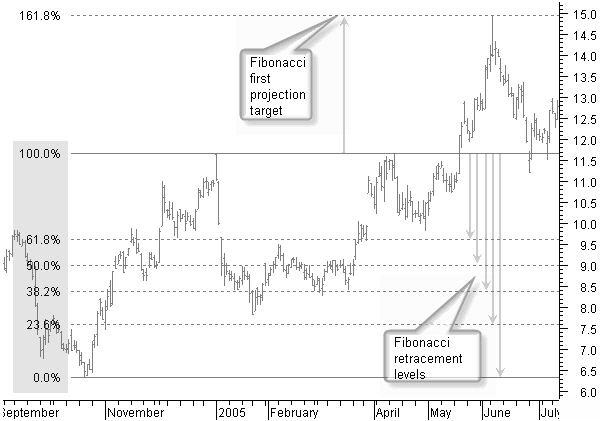
Figure 9.3: Fibonacci levels giving support and resistance to future price movement.
In figure 9.3, creating the Fibonacci levels from a 0% rise until a 100% price up-move between the end of September and December 2004, shows a number of horizontal lines giving support and resistance to future price movement.
By the end of May, previous top levels around $11.70 were broken. The price then continued to move right up to the next Fibonacci level at 161.8%, or $15.
Looking at the same chart with weekly bars in figure 9.4 and a new Fibonacci projection between the start of the up-move in September 2004 until the first reached target at $15 in June 2005, gives new future price targets.
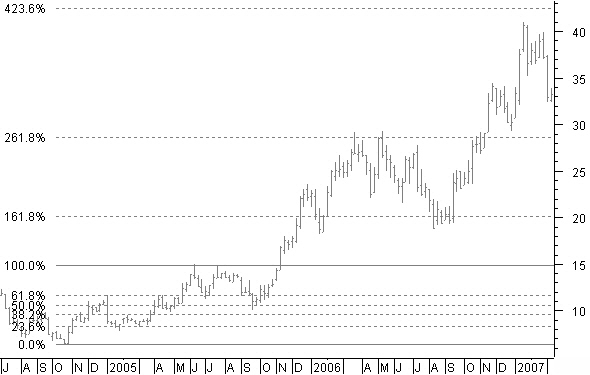
Figure 9.4: New Fibonacci projection targets on weekly chart.
Where do you think price moved to? Believe it or not, right up to Fibonacci levels 161.8%, 261.8%, and very close to 423.6%.
Fibonacci Levels in a Downtrend
We use a chart of AHOLD a Dutch stock to look at Fibonacci levels in a downtrend.
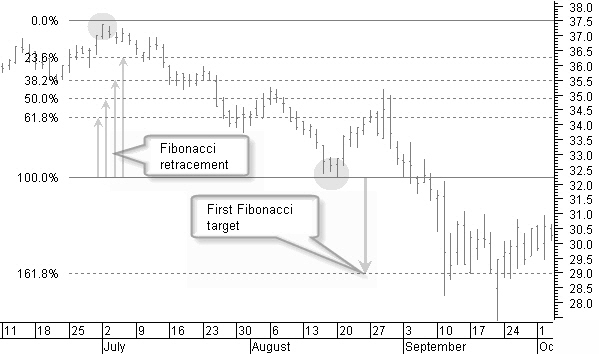
Figure 9.5: Fibonacci retracements and projection levels in a downtrend.
Creating the Fibonacci levels in figure 9.5 from a 0% price drop until a 100% price down between the beginning of July and mid August, shows a number of horizontal Fibonacci retracement levels giving support and resistance to future price movement.
At the beginning of September, a previous bottom at €32.2 was broken. The price then continued to move down until the next Fibonacci level at 161.8%, or €29.0.
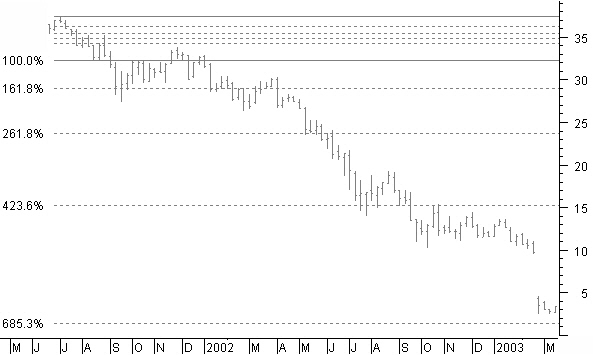
Figure 9.6: Fibonacci projection levels reached on weekly downtrend example chart.
Next, have a look on the weekly chart of figure 9.6 to see what other levels have been reached. You find this hard to believe?
Historical Fibonacci Projection
When price changes from for example a downtrend to an uptrend, it is only possible to draw Fibonacci retracement levels for the past downtrend move, using this retracement levels as price targets for the new up move.
It is clear that at the start of a price turning point, there is no second reference point available for a Fibonacci projection; however, since support and resistance levels from the past also are many times continued in the future, it is not unusual that previous support or resistance can be used as the second reference point for a Fibonacci projection into the future.
The NASDAQ index in figure 9.7 went down from 1750 to 1450. After the turning point in July, we expect an up-move. For a future price estimation, we created a Fibonacci projection with the reference low point in mid July and the last previous top, which gave a first target at a level of 1680.
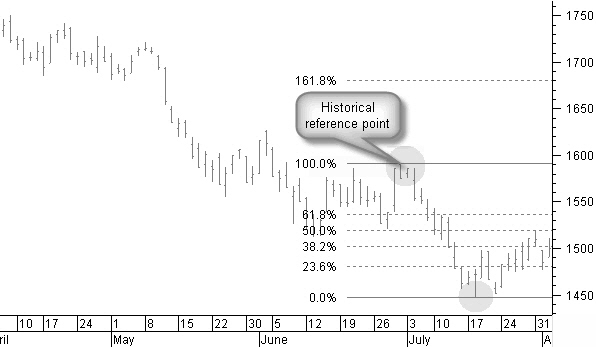
Figure 9.7: Fibonacci historical projection principle.
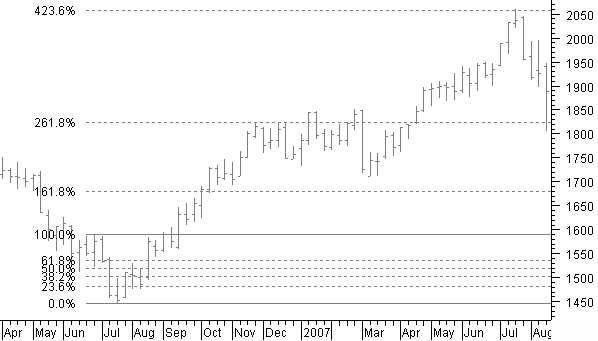
Figure 9.8: Fibonacci historical projection confirmed.
Figure 9.8 shows that not only we reached the target at 1680, but we also reached the Fibonacci projections at 261.8% and 423.6% from the same historical reference point.
Reaching a Fibonacci target level is an important part of the signals used to close a position.
Technical Analysis Price Projections Next -Previous -Part 1 -Part 2 -Part 3 -Part 4
STOCATA Stocks Technical Analysis HOME
Links
Find a Stock ticker symbol, enter the ticker and find a chart, news, fundamentals and historical quotes.
Risk Disclosure: Futures and forex trading contains substantial risk and is not for every investor. An investor could potentially lose all or more than the initial investment. Risk capital is money that can be lost without jeopardizing ones’ financial security or life style. Only risk capital should be used for trading and only those with sufficient risk capital should consider trading. Past performance is not necessarily indicative of future results.
Hypothetical Performance Disclosure: Hypothetical performance results have many inherent limitations, some of which are described below. no representation is being made that any account will or is likely to achieve profits or losses similar to those shown; in fact, there are frequently sharp differences between hypothetical performance results and the actual results subsequently achieved by any particular trading program. One of the limitations of hypothetical performance results is that they are generally prepared with the benefit of hindsight. In addition, hypothetical trading does not involve financial risk, and no hypothetical trading record can completely account for the impact of financial risk of actual trading. for example, the ability to withstand losses or to adhere to a particular trading program in spite of trading losses are material points which can also adversely affect actual trading results. There are numerous other factors related to the markets in general or to the implementation of any specific trading program which cannot be fully accounted for in the preparation of hypothetical performance results and all which can adversely affect trading results.
See more 'Legal Disclosures' in the bottom menu bar!