
Latest News
2022 Start working on a new website
BBS Trading Expert
Watch the Youtube BBS video and here is a crude oil trading example
Want to know more about:
AXIOM business books awards, bronze medal! Thank You!
No longer available!
Favorite articles in 2010, 11, 12, 14 and 2015 S&C Readers' Choice Awards.

AXIOM Business Books Awards, bronze medal.

Technical Analysis Price Projections Part 3
Andrews Pitchfork
Alan Hall Andrews is known in technical analysis for creating a method known today the “Andrews pitchfork”.
Action-reaction
Andrews describes his application as the median line method. The application of the median line method came from the ideas of Sir Isaac Newton and Roger Babson, including, among other things Newton’s first law: “For each action, there is an equal reaction.”
Special offer: "Capturing Profit with technical Analysis"
The Median Line
Construction
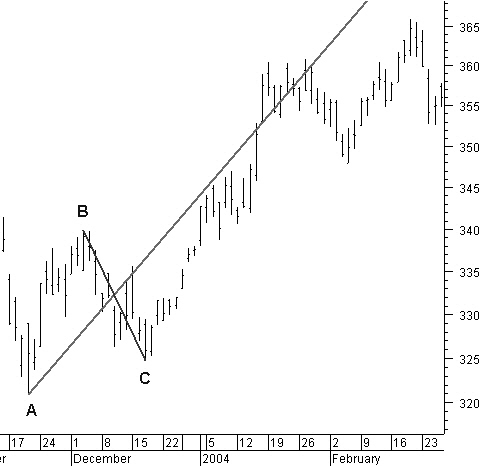
Figure 9.9: Construction of the median line.
1. Calculate the midpoint of the reaction B-C (the line B-C is normally not drawn).
2. From a previous reference, high or low point, draw a line through this midpoint. This is the median line.
Trading Based on the Median Line
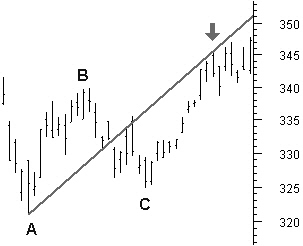
Figure 9.10: Price returning to the median line 80% of the time.
1. The price will return to the median line about 80% of the time (figure 9.10).
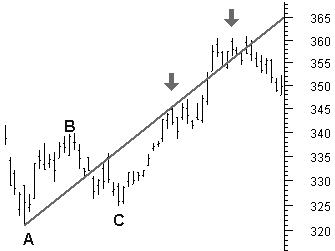
Figure 9.11: Median line showing support and resistance.
2. The median line is a resistance and support line. The price will react around the median line (figure 9.11).
3. The price returning to the median line often will move for some time around that median line before a new direction is chosen (figure 9.11).
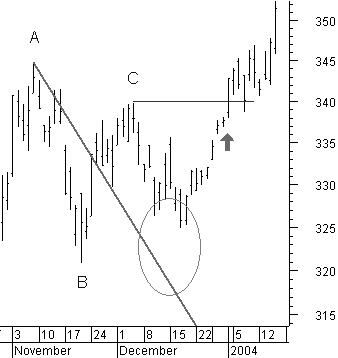
Figure 9.12: Price not touching the median line will push price in opposite direction.
4. If the price does not complete touching the median line, it will move in the opposite direction, past the price turning point used for the construction of the median line (figure 9.12).
The Pitchfork
After calculating and drawing the median line, Andrews added two additional lines parallel to the median line, from the points B and C.
This created parallel lines above and below the median line.
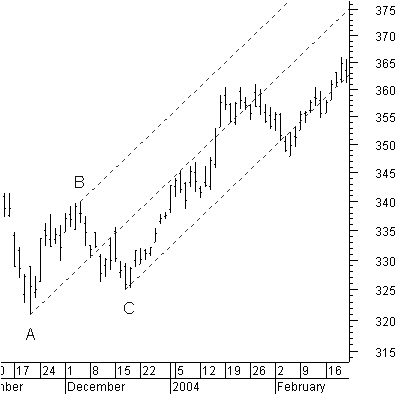
Figure 9.13: Andrews pitchfork channel.
These three lines are called the Andrews pitchfork (figure 9.13). Prices tend to move for some time within this pitchfork channel, similar to a trend channel.
Like in a trend channel, prices find support and resistance at the lower and upper side of the pitchfork channel.
Warning Lines
Andrews then added parallel lines in the past and the future at the same distance as the parallel lines from the median line; he called these warning lines.
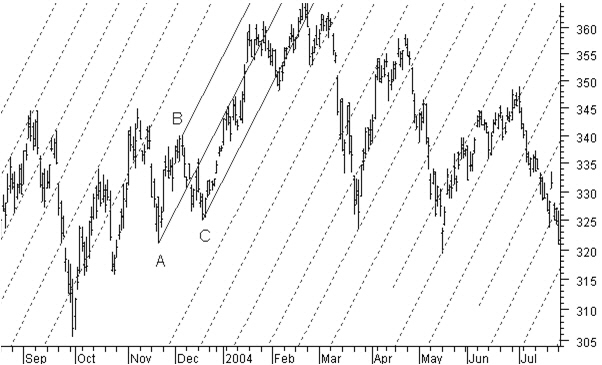
Figure 9.14: Pitchfork warning lines.
In figure 9.14, you will notice that the price will move regularly to and within the boundaries of these warning lines.
I use the Andrews pitchfork mainly as a price target tool to see if price is reaching the median line (80% of the time). If price does not reach the median line we know to what level it will move next as a minimum. Additionally the outer lines of the pitchfork are quite effective as a trend channel giving us upper and lower boundaries for future price moves.
Technical Analysis Price Projections Next -Previous -Part 1 -Part 2 -Part 3 -Part 4
STOCATA Stocks Technical Analysis HOME
Links
Find a Stock ticker symbol, enter the ticker and find a chart, news, fundamentals and historical quotes.
Risk Disclosure: Futures and forex trading contains substantial risk and is not for every investor. An investor could potentially lose all or more than the initial investment. Risk capital is money that can be lost without jeopardizing ones’ financial security or life style. Only risk capital should be used for trading and only those with sufficient risk capital should consider trading. Past performance is not necessarily indicative of future results.
Hypothetical Performance Disclosure: Hypothetical performance results have many inherent limitations, some of which are described below. no representation is being made that any account will or is likely to achieve profits or losses similar to those shown; in fact, there are frequently sharp differences between hypothetical performance results and the actual results subsequently achieved by any particular trading program. One of the limitations of hypothetical performance results is that they are generally prepared with the benefit of hindsight. In addition, hypothetical trading does not involve financial risk, and no hypothetical trading record can completely account for the impact of financial risk of actual trading. for example, the ability to withstand losses or to adhere to a particular trading program in spite of trading losses are material points which can also adversely affect actual trading results. There are numerous other factors related to the markets in general or to the implementation of any specific trading program which cannot be fully accounted for in the preparation of hypothetical performance results and all which can adversely affect trading results.
See more 'Legal Disclosures' in the bottom menu bar!