
Latest News
2022 Start working on a new website
BBS Trading Expert
Watch the Youtube BBS video and here is a crude oil trading example
Want to know more about:
AXIOM business books awards, bronze medal! Thank You!
No longer available!
Favorite articles in 2010, 11, 12, 14 and 2015 S&C Readers' Choice Awards.

AXIOM Business Books Awards, bronze medal.

Stock Market Proprietary Indicators Part 2
Price Smoothing
If you want to determine the short-term market direction, there shouldn’t be any delay when you smooth the price trend.
You can accomplish this using heikin-ashi recalculated prices and a short-term triple exponential moving average (TEMA).
Special offer: "Capturing Profit with technical Analysis"
In MetaStock® code, you can do this using the following formula:
haOpen:=(Ref((O+H+L+C)/4,-1) + PREV)/2;
haCl:=((O+H+L+C)/4+haOpen+Max(H,haOpen)+Min(L,haOpen))/4;
haC:=Tema(haCl,5);
Figure 8.4 shows the effect of this smoothing technique.
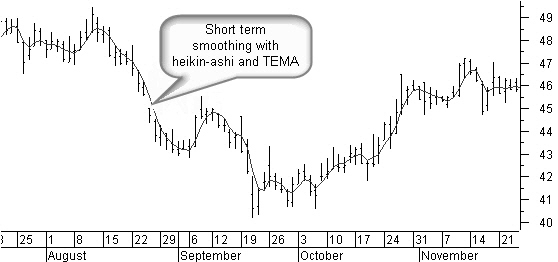
Figure 8.4: Effect of TEMA on heikin-ashi closing average smoothing technique.
Volume Smoothing
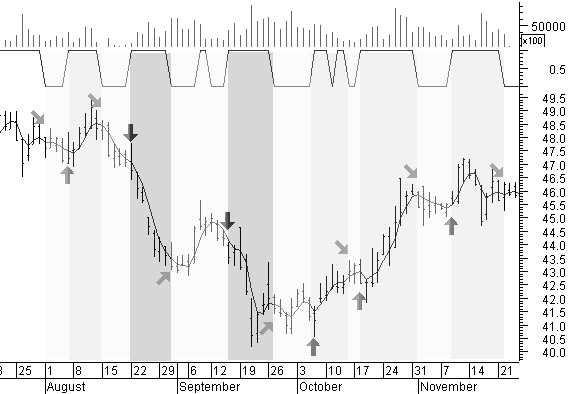
Figure 8.5: Result of the volume smoothing techniques.
In figure 8.5, taking a look at the volume bars of Dow Chemical at the top of the chart, you can see that determining the short-term volume trend is no simple task. The first action item is to limit single extreme-volume counts. So we compare the volume with a medium-term simple moving average of the previous volume, and limit an extreme value to no more than twice that moving average.
In MetaStock code, it can be done this way:
vave:=Ref(Mov(V,40,S),-1);
vmax:=vave*2;
vc:=If(V<vmax,V,vmax);
The second action item is to smooth without creating delays. One of the better methods of tracking the short-term trend of volume is by linear regression. You can smooth the linear regression slope with a short-term TEMA average, but the result will still not be smooth enough. So, in the final step, we maintain the previous calculated result over a period of two bars. The final result of this volume-trend smoothing can be seen as a digital value below the volume bars in figure 8.05.
In MetaStock code, it is done this way:
vtr:=Tema(LinRegSlope(vc,8),8);
Alert(vtr >= Ref(vtr,-1),2);
The arrows on the price bars in figure 8.5 correspond to the changes in price trend. A vertical up arrow represents volume uptrend with price uptrend, while a vertical down arrow represents volume uptrend with price downtrend. The sideways up arrow represents a downtrend in volume during a correction phase in a price downtrend. The sideways downward arrow represents a volume downtrend during a correction phase in a price uptrend. As you can see, this corresponds quite well with the short-term market direction.
SVAPO “Short-term Volume and Price Oscillator”
(I like the term SVAPO because it starts with my initials!)
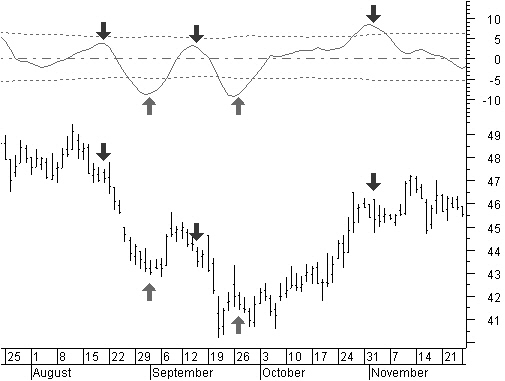
Figure 8.6: SVAPO oscillator in action. Turning points in SVAPO gives profitable trades.
In the figure 8.6, you can see the SVAPO oscillator in action on the same chart as on the previous figure. Just using the turning points in the oscillator yields profitable trades.
In addition to calculating and smoothing the heikin-ashi closing average and smoothing the volume, we also include a minimum required price change before any volume is taken into consideration. This minimum change often will not be reached when the price is making candlestick doji’s. This is the price area with uncertainty, which is why it is probably best not to take the volume of these bars into consideration. Because volume often counts in millions, we divide the result by a medium-term average of the volume. This brings the oscillator swing somewhere around a more readable +/-10.
Since tops and bottoms of the SVAPO oscillator are not a fixed value, it is a good idea to have a reference to determine if the oscillator is beyond its normal upper or lower boundary; therefore, I added standard-deviation lines from the mean, with 1.5 at the upper end and 1.3 at the lower end, together with the zero reference.
This is the complete SVAPO MetaStock formula:
{calculate the heikin-ashi closing average haCl and get the input variables}
haOpen:=(Ref((O+H+L+C)/4,-1) + PREV)/2;
haCl:=((O+H+L+C)/4+haOpen+Max(H,haOpen)+Min(L,haOpen))/4;
period:= Input("SVAPO period :", 2, 20, 8);
cutoff:= Input("Minimum %o price change :",0,10,1);
{Inputs for standard deviation bands}
devH:= Input("Standard Deviation High :", 0.1, 5, 1.5);
devL:= Input("Standard Deviation Low :", 0.1, 5, 1.3);
stdevper:= Input("Standard Deviation Period :", 1, 200, 100);
{Smooth HaCl closing price}
haC:=Tema(haCl,period/1.6);
{Medium term MA of Volume to limit extremes and division factor}
vave:=Ref(Mov(V,period*5,S),-1);
vmax:=vave*2;
vc:=If(V<vmax,V,vmax);
{Basic volume trend}
vtr:=Tema(LinRegSlope(V,period),period);
{SVAPO result of price and volume}
SVAPO:=Tema(Sum(If(haC>(Ref(haC,-1)*(1+cutoff/1000)) AND Alert(vtr>=Ref(vtr,-1),2), vc, If(haC<(Ref(haC,-1)*(1-cutoff/1000)) AND Alert(vtr>Ref(vtr,-1),2),-vc,0)),period)/(vave+1),period);
devH*Stdev(SVAPO,stdevper);
-devL*Stdev(SVAPO,stdevper);
zeroref:=0;
zeroref;
SVAPO
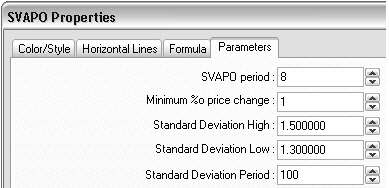 The defaults used for SVAPO are shown in figure 8.7 with a period of eight bars, a minimum per thousand price change of one; a standard deviation of 1.5 on the upper side; and 1.3 on the lower side, with 100 bars as the standard-deviation look back period.
Figure 8.7: The SVAPO defaults.
These defaults work well in all time frames, from minute and hourly charts to daily, weekly, and monthly charts. If you want very short-term signals, you can go as low as a 3-bar SVAPO.
Now that you know how to create SVAPO, I will discuss the SVAPO trading rules, entry/exit signals, and how to determine price targets.
Proprietary Technical Indicators Next -Previous -Part 1 -Part 2 -Part 3 -Part 4 -Part 5
STOCATA Stocks Technical Analysis HOME
Links
Find a Stock ticker symbol, enter the ticker and find a chart, news, fundamentals and historical quotes.
Risk Disclosure: Futures and forex trading contains substantial risk and is not for every investor. An investor could potentially lose all or more than the initial investment. Risk capital is money that can be lost without jeopardizing ones’ financial security or life style. Only risk capital should be used for trading and only those with sufficient risk capital should consider trading. Past performance is not necessarily indicative of future results.
Hypothetical Performance Disclosure: Hypothetical performance results have many inherent limitations, some of which are described below. no representation is being made that any account will or is likely to achieve profits or losses similar to those shown; in fact, there are frequently sharp differences between hypothetical performance results and the actual results subsequently achieved by any particular trading program. One of the limitations of hypothetical performance results is that they are generally prepared with the benefit of hindsight. In addition, hypothetical trading does not involve financial risk, and no hypothetical trading record can completely account for the impact of financial risk of actual trading. for example, the ability to withstand losses or to adhere to a particular trading program in spite of trading losses are material points which can also adversely affect actual trading results. There are numerous other factors related to the markets in general or to the implementation of any specific trading program which cannot be fully accounted for in the preparation of hypothetical performance results and all which can adversely affect trading results.
See more 'Legal Disclosures' in the bottom menu bar!