
Latest News
2022 Start working on a new website
BBS Trading Expert
Watch the Youtube BBS video and here is a crude oil trading example
Want to know more about:
AXIOM business books awards, bronze medal! Thank You!
No longer available!
Favorite articles in 2010, 11, 12, 14 and 2015 S&C Readers' Choice Awards.

AXIOM Business Books Awards, bronze medal.

Stock Market Proprietary Indicators Part 3
Basic Trading Rules
The trading rules I will discuss here are based on an 8-bar short term volume and price oscillator period with a 1/1000 minimum price change and with an upper standard deviation channel at 1.5 and 1.3 at the lower side over a 100-day period.
Special offer: "Capturing Profit with technical Analysis"
Rule 1:
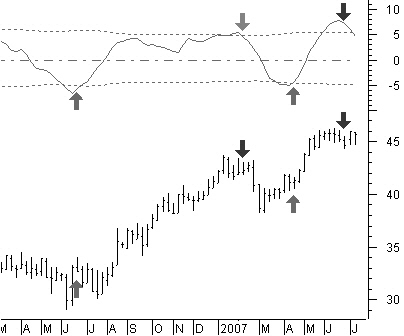
The start of a short term up-move is signaled when SVAPO turns up from below the lower standard deviation boundary, as shown in the weekly chart of Hewlett-Packard in figure 8.8.
The same is valid for a short-term down move when SVAPO turns down from above the upper standard deviation boundary.
Figure 8.8: HP with SVAPO turning up and down from the standard deviation boundaries.
Rule 2:
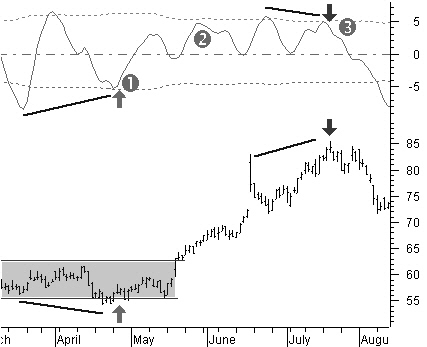
Medium-term turning points in an uptrend or downtrend are usually indicated with a divergence between price and SVAPO, as shown in figure 8.9. See the divergence (1) at the end of April. The SVAPO has higher lows, while the price has lower lows. At the end of the medium term uptrend at (3), another divergence appears with lower highs in SVAPO and higher highs in price.
Figure 8.9: SVAPO trading rules 1, 2 and 3.
Rule 3:
In a medium-term uptrend, SVAPO will generally continue to move above the zero-reference line. Look at reference (2) in figure 8.9. In a medium-term downtrend, SVAPO will generally continue to move below the zero-reference line.
Rule 4:
For short-term scalping or for finding additional medium-term entry points, SVAPO can be used with a period of only three bars and no minimum price change.
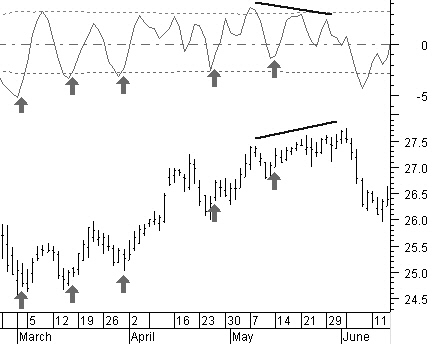
Figure 8.10: SVAPO rule 4 short term trading.
Look at the different entry points in figure 8.10 on the Pfizer chart indicated by SVAPO at the start of and during the medium-term uptrend.
Note how each entry point is a profitable short-term trade on its own.
The medium-term turning point is reached when SVAPO passes the upper boundary and diverges by the end of May.
Application Example
The Allis Chalmers Energy Inc. chart (figure 8.11) shows an ideal buying moment when, after a big correction, SVAPO turns up in the beginning of March, creating a divergence with the price.
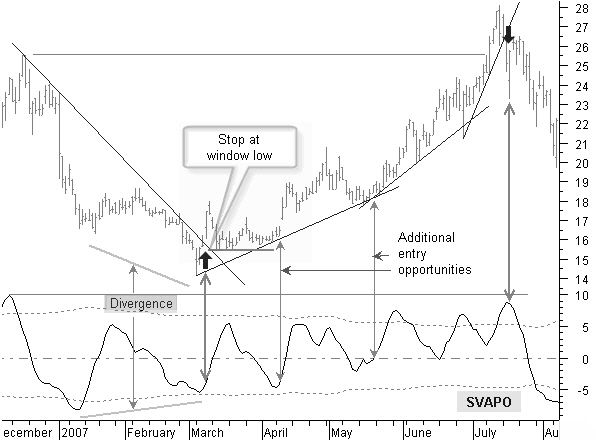
Figure 8.11: Ideal buying moment after a big correction and SVAPO diverging.
At the same moment in time, the price moves up, breaking the medium-term downtrend. Interestingly, there is a small window the day before, and the support of this window allows maintaining a very tight stop.
After a couple of days of reaction, the price remains flat for some time without breaking the initial stop level. At the end of this move, there is a second opportunity to enter a trade when SVAPO turns up once more. Next, we can draw an uptrend line and see that the price touches this trend line again during the second half of May; this is another entry opportunity.
With the price now moving up faster, we can draw a sharper uptrend line. Starting from July, the price starts going up even faster. It is clear that this kind of speed will not last very long.
This trend line is broken by the end of July with SVAPO turning down from a higher top; however, looking at the medium-term top from December 2006 and the new top now, we see a divergence between the higher top in price and a lower top in SVAPO.
It’s time to take a profit!
Proprietary Technical Indicators Next -Previous -Part 1 -Part 2 -Part 3 -Part 4 -Part 5
STOCATA Stocks Technical Analysis HOME
Links
Find a Stock ticker symbol, enter the ticker and find a chart, news, fundamentals and historical quotes.
Risk Disclosure: Futures and forex trading contains substantial risk and is not for every investor. An investor could potentially lose all or more than the initial investment. Risk capital is money that can be lost without jeopardizing ones’ financial security or life style. Only risk capital should be used for trading and only those with sufficient risk capital should consider trading. Past performance is not necessarily indicative of future results.
Hypothetical Performance Disclosure: Hypothetical performance results have many inherent limitations, some of which are described below. no representation is being made that any account will or is likely to achieve profits or losses similar to those shown; in fact, there are frequently sharp differences between hypothetical performance results and the actual results subsequently achieved by any particular trading program. One of the limitations of hypothetical performance results is that they are generally prepared with the benefit of hindsight. In addition, hypothetical trading does not involve financial risk, and no hypothetical trading record can completely account for the impact of financial risk of actual trading. for example, the ability to withstand losses or to adhere to a particular trading program in spite of trading losses are material points which can also adversely affect actual trading results. There are numerous other factors related to the markets in general or to the implementation of any specific trading program which cannot be fully accounted for in the preparation of hypothetical performance results and all which can adversely affect trading results.
See more 'Legal Disclosures' in the bottom menu bar!