
Latest News
2022 Start working on a new website
BBS Trading Expert
Watch the Youtube BBS video and here is a crude oil trading example
Want to know more about:
AXIOM business books awards, bronze medal! Thank You!
No longer available!
Favorite articles in 2010, 11, 12, 14 and 2015 S&C Readers' Choice Awards.

AXIOM Business Books Awards, bronze medal.

Stocks Technical Analysis Trendlines Part 2
Trendline Evolution
A medium to longer term uptrend or downtrend not always evolutes the same way. Looking at different charts and periods we noticed that from the start of a new price move, the trend shows three possible scenarios before reaching the end of that trend:
- No change; the price continues to move along the trendline until it breaks the trendline.
- The price accelerates and moves far away from the trendline; you need to draw a new, steeper trendline.
- The price decelerates and breaks the trend moderately and continues, temporarily, less steep or even flat.
- Of course in some longer term price moves you will find all three possibilities combined in one trend.
Special offer: "Capturing Profit with technical Analysis"
No Change
If there’s no change (figure 4.21), the trendline stays intact during the whole up- or down-move.
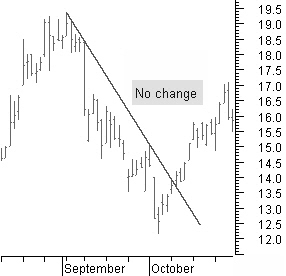
When the trendline is broken, it is the start of a new trend in that specific time period.
It is rather uncommon that there is no change.
Medium- and long-term moves will show most of the time a change in trend acceleration.
Figure 4.21: No change in trendline evolution.
Accelerating
Price acceleration often is a three-step process (figure 4.22). The trend is broken after the third change in acceleration, when it has become a very sharp move.
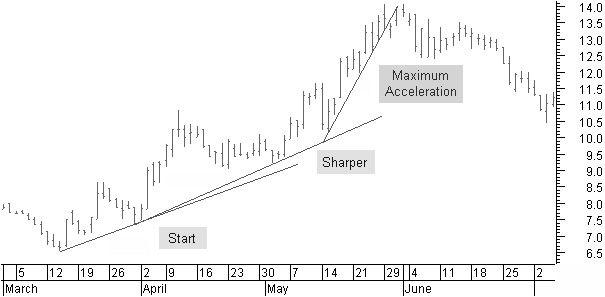
Figure 4.22: Trendline acceleration.
Later when we talk about price chart patterns, you will see that these changes in acceleration often are announced by a price continuation pattern.
Slowing Down
A longer-term uptrend starting with a sharp up-move will generally slow down.
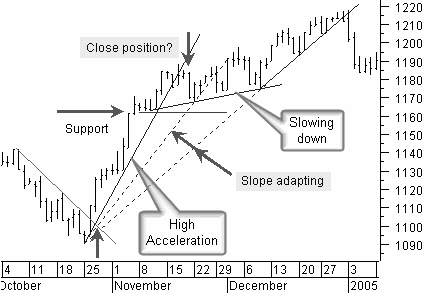
Figure 4.23: Trendline deceleration.
In figure 4.23, you can see how short-term reactions against the main trend will slow down the up-move. A longer-term flatter price channel is formed.
The S&P500 index in figure 4.23 gives a buy signal at the end of October 2004 when the closing price moves above the downtrend line. The price takes off with high acceleration. It is clear that this cannot be sustained for a long period of time.
The price continues to move higher, but not at the beginning speed. So when this sharp trendline is broken, do we have to close the position?
Because of the previously high acceleration, you should leave enough room for the price to slow down. For example, you can use a support line or a trailing stop level to allow this process.
Most of the time, the trailing stop will not be broken if the price continues to move higher.
After some time you can draw a flatter trendline followed by a steeper trendline, as is the case here. You can of course, also adapt the slope from the start (dotted trendlines) to represent the new longer-term trendline.
Technical Analysis Trendlines Next -Previous -Part 1 -Part 2 -Part 3 -Part 4 -Part 5
STOCATA Stocks Technical Analysis HOME
Links
Find a Stock ticker symbol, enter the ticker and find a chart, news, fundamentals and historical quotes.
Risk Disclosure: Futures and forex trading contains substantial risk and is not for every investor. An investor could potentially lose all or more than the initial investment. Risk capital is money that can be lost without jeopardizing ones’ financial security or life style. Only risk capital should be used for trading and only those with sufficient risk capital should consider trading. Past performance is not necessarily indicative of future results.
Hypothetical Performance Disclosure: Hypothetical performance results have many inherent limitations, some of which are described below. no representation is being made that any account will or is likely to achieve profits or losses similar to those shown; in fact, there are frequently sharp differences between hypothetical performance results and the actual results subsequently achieved by any particular trading program. One of the limitations of hypothetical performance results is that they are generally prepared with the benefit of hindsight. In addition, hypothetical trading does not involve financial risk, and no hypothetical trading record can completely account for the impact of financial risk of actual trading. for example, the ability to withstand losses or to adhere to a particular trading program in spite of trading losses are material points which can also adversely affect actual trading results. There are numerous other factors related to the markets in general or to the implementation of any specific trading program which cannot be fully accounted for in the preparation of hypothetical performance results and all which can adversely affect trading results.
See more 'Legal Disclosures' in the bottom menu bar!