
Latest News
2022 Start working on a new website
BBS Trading Expert
Watch the Youtube BBS video and here is a crude oil trading example
Want to know more about:
AXIOM business books awards, bronze medal! Thank You!
No longer available!
Favorite articles in 2010, 11, 12, 14 and 2015 S&C Readers' Choice Awards.

AXIOM Business Books Awards, bronze medal.

Stocks Technical Analysis Trendlines Part 4
Centerline
The centerline is drawn between a bottom pivot point and a top pivot point or visa versa. This kind of trendline can be used as a reference for action-reaction lines.
Special offer: "Capturing Profit with technical Analysis"
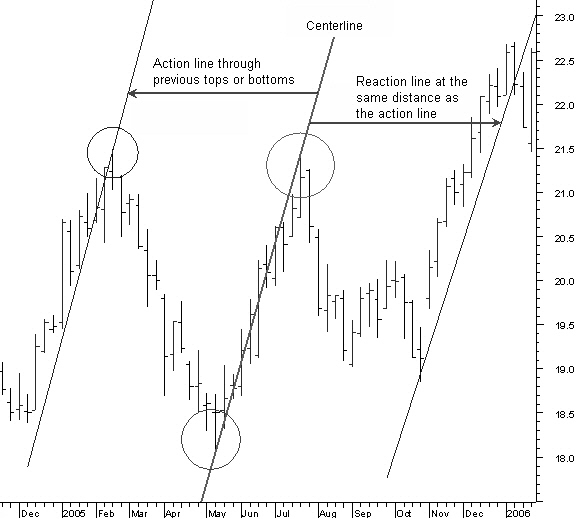
Figure 4.28: Centerline.
In figure 4.28, a parallel line with the centerline through a previous high or low point is the action reference. Preferably, the action line and the price data should show a similar slope.
From here on, you can create a second parallel line; this is the reaction line projected into the future. The distance from the centerline is equal to the distance between the centerline and the action line.
Note how the prices turn at the reaction line and how they start moving up again with about the same slope as the original top-bottom centerline.
Multi-reversal Line
A multi-reversal line touches the bottoms as well as the tops of the price bars. Multi-reversal lines are mostly used as a reference for action/reaction lines but also for future support or resistance in relation with future price projections.
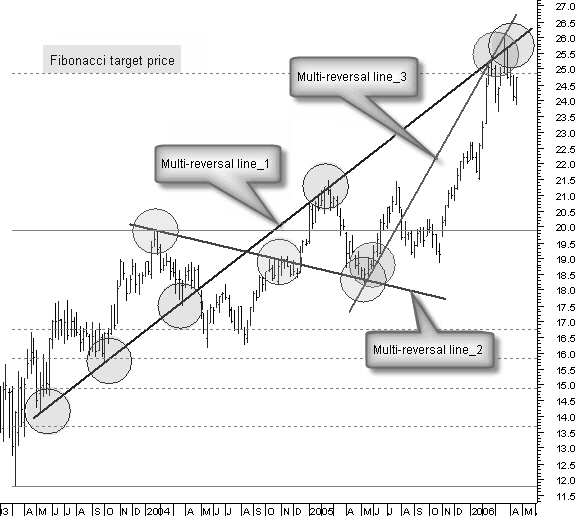
Figure 4.29: Multi-reversal line.
In figure 4.29, look at how multi-reversal lines show support and resistance to future price movement. Multi-reversal lines complement price targets, since they can be used as reference for future price support and resistance.
Note how all multi-reversal lines are close to the $25 target given by a Fibonacci projection (dashed horizontal line). This gives a good time estimate as to when this first Fibonacci target can be reached.
The centerline and multi-reversal line are most useful finding targets both price and time related.
Technical Analysis Trendlines Next -Previous -Part 1 -Part 2 -Part 3 -Part 4 -Part 5
STOCATA Stocks Technical Analysis HOME
Links
Find a Stock ticker symbol, enter the ticker and find a chart, news, fundamentals and historical quotes.
Risk Disclosure: Futures and forex trading contains substantial risk and is not for every investor. An investor could potentially lose all or more than the initial investment. Risk capital is money that can be lost without jeopardizing ones’ financial security or life style. Only risk capital should be used for trading and only those with sufficient risk capital should consider trading. Past performance is not necessarily indicative of future results.
Hypothetical Performance Disclosure: Hypothetical performance results have many inherent limitations, some of which are described below. no representation is being made that any account will or is likely to achieve profits or losses similar to those shown; in fact, there are frequently sharp differences between hypothetical performance results and the actual results subsequently achieved by any particular trading program. One of the limitations of hypothetical performance results is that they are generally prepared with the benefit of hindsight. In addition, hypothetical trading does not involve financial risk, and no hypothetical trading record can completely account for the impact of financial risk of actual trading. for example, the ability to withstand losses or to adhere to a particular trading program in spite of trading losses are material points which can also adversely affect actual trading results. There are numerous other factors related to the markets in general or to the implementation of any specific trading program which cannot be fully accounted for in the preparation of hypothetical performance results and all which can adversely affect trading results.
See more 'Legal Disclosures' in the bottom menu bar!