
Latest News
2022 Start working on a new website
BBS Trading Expert
Watch the Youtube BBS video and here is a crude oil trading example
Want to know more about:
AXIOM business books awards, bronze medal! Thank You!
No longer available!
Favorite articles in 2010, 11, 12, 14 and 2015 S&C Readers' Choice Awards.

AXIOM Business Books Awards, bronze medal.

Stocks Technical Analysis Trendlines Part 3
Special Trendlines
 Inverse Trendline
Sometimes it may seem difficult to start drawing a normal trendline.
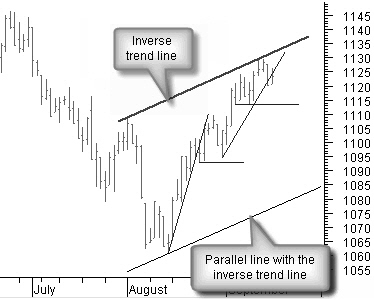
In figure 4.24, the move starts with a sharp trendline up.
Next, the prices slow down for a short time; then subsequently continue with high acceleration.
In such a scenario, it is difficult to draw a trendline or price channel that would help to estimate future price targets.
Figure 4.24: Inverse trendline.
Special offer: "Capturing Profit with technical Analysis"
This is where the inverse trendline comes in handy. The last price high in September and a previous end of July high pivot are good reference points for drawing the inverse thick trendline in figure 4.24. In an ascending trend, the inverse trendline is drawn from price tops. In a descending trend, the inverse trendline is drawn from price bottoms.
From the lowest bottom in August, you now can draw a parallel line with the inverse trendline, creating the other side of what probably will become a future price channel.
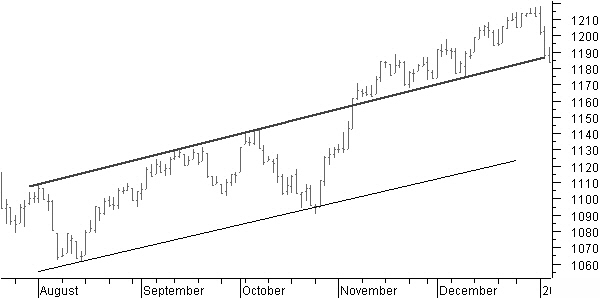
Figure 4.25: Inverse trendline evolution.
Figure 4.25 shows the further price evolution perfectly in line with the trend channel created on the base of the inverse trendline. Sometimes you will see a normal downtrend line and an inverse trendline that have different slopes.
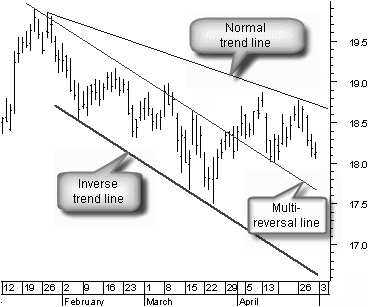
Figure 4.26: Normal and inverse trendline.
As you can see in figure 4.26, the prices touch both the inverse trendline and the parallel line. The parallel line with the inverse trendline from the start of the downtrend forms a multi-reversal line that alternates between resistance and support. It also looks as if the downtrend channel is widening.
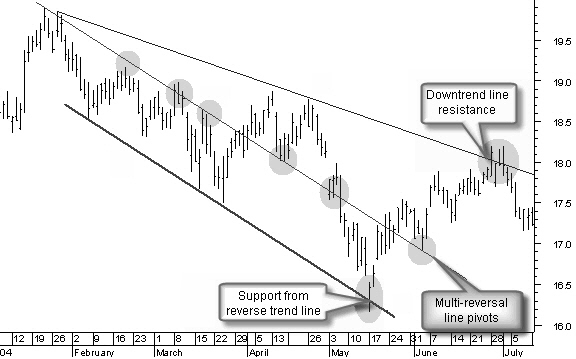
Figure 4.27: Normal and inverse trendline evolution.
Looking at the further price development in figure 4.27, it is funny to see how each of the trendlines does the job. The inverse trendline gives support, just like the multi-reversal line does, while the normal downtrend line is now resisting.
The inverse trendline is a good tool to find medium and longer term trends when it is not possible to draw a normal trendline in the early stage of a new trend development.
Technical Analysis Trendlines Next -Previous -Part 1 -Part 2 -Part 3 -Part 4 -Part 5
STOCATA Stocks Technical Analysis HOME
Links
Find a Stock ticker symbol, enter the ticker and find a chart, news, fundamentals and historical quotes.
Risk Disclosure: Futures and forex trading contains substantial risk and is not for every investor. An investor could potentially lose all or more than the initial investment. Risk capital is money that can be lost without jeopardizing ones’ financial security or life style. Only risk capital should be used for trading and only those with sufficient risk capital should consider trading. Past performance is not necessarily indicative of future results.
Hypothetical Performance Disclosure: Hypothetical performance results have many inherent limitations, some of which are described below. no representation is being made that any account will or is likely to achieve profits or losses similar to those shown; in fact, there are frequently sharp differences between hypothetical performance results and the actual results subsequently achieved by any particular trading program. One of the limitations of hypothetical performance results is that they are generally prepared with the benefit of hindsight. In addition, hypothetical trading does not involve financial risk, and no hypothetical trading record can completely account for the impact of financial risk of actual trading. for example, the ability to withstand losses or to adhere to a particular trading program in spite of trading losses are material points which can also adversely affect actual trading results. There are numerous other factors related to the markets in general or to the implementation of any specific trading program which cannot be fully accounted for in the preparation of hypothetical performance results and all which can adversely affect trading results.
See more 'Legal Disclosures' in the bottom menu bar!