
Latest News
2022 Start working on a new website
BBS Trading Expert
Watch the Youtube BBS video and here is a crude oil trading example
Want to know more about:
AXIOM business books awards, bronze medal! Thank You!
No longer available!
Favorite articles in 2010, 11, 12, 14 and 2015 S&C Readers' Choice Awards.

AXIOM Business Books Awards, bronze medal.

Stocks & Commodities Interview
May 2014, Part 2
S&C Interview: Next -Previous -Part 1 -Part 2 -Part 3 -
Interviewed by Jayanthi Gopalakrishnan from "Stocks & Commodities magazine"
CopyRight 2014 Stocks & Commodities magazine.
And modified renko charts?
Renko charts, developed by the Japanese, were likely named after the Japanese word for bricks, which is renga. As with range bars, renko charts take only price into account. A renko chart is constructed by placing a brick in the next column once the price surpasses the top or bottom of the previous brick by a predefined number of ticks. It is important to know that gaps larger than the brick size will be automatically filled with additional virtual bricks. This basic renko chart looks nice. Unfortunately, no wicks are shown, and remember, gaps are filled with virtual bricks. This means that the opening or closing price of a bar may not be where you think it is. This is especially confusing using historical backtesting or real-time trading, opening a position after a buy or sell signal at the opening price of the following bar. Your profit and loss calculation will just not be correct. Buying after a gap up will not be at the beginning of the gap. Instead, it will be at the end of the gap with a price difference the size of the gap. That is why you need a modified renko bar chart like the one in Figure 3, giving correct opening and closing prices and possibly a wick. Note that with the standard modified renko chart similar to the one I am using in Figure 3, the problem of gap filling still exists. However, when trading forex or futures with a 24-hour notation, the problem will be limited. But if you are using a notation with gaps, for example, if you trade forex during regular US trading hours only, the best thing to do is show the gaps in the chart.
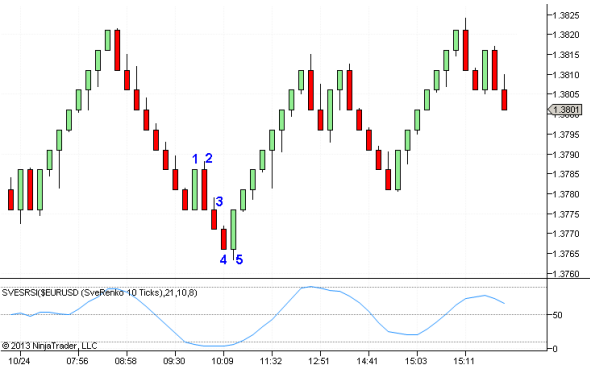
Figure 3: Modified Renko Chart
Most of the (larger) gaps will be at the daily session breaks. You can imagine that indicators based on the charts without gaps will be different from those based on charts with gaps. Since I am now using mainly modified renko charts for my trading, I am not looking for candlestick patterns, because they do not apply, and a number of chart price patterns are not applicable with the modified renko bars. My chart template just uses one indicator, and that’s a fast and slow stochastic RSI. I do, of course, use standard technical analysis tools such as passive and active support & resistance levels; inclusive levels created by Fibonacci projections & retracements; and I look at daily pivot points with real-time intraday charts. Because I am used to counting Elliott waves, they are still in the back of my mind when I look at waves. However, since writing “The 1-2-3 Wave Count,” which you published in this magazine in the June 2013 issue, I mainly use that count to distinguish waves. In fact, I am working on an update of this wave count.
That’s good to hear. Look forward to hearing more about it when it’s ready. How do you select the stocks you wish to trade?
To trade stocks, I look at a weekly and daily chart to find those with a history of large moves over longer time periods. This stock selection is a manual process to find a limited number of stocks that I want to trade. If I find more stocks than needed, I would look at the daily moves and keep those with the highest average percentage value obtained using the following formula: (High – Low) / (Low + (High – Low) /2) * 100 Next, I would avoid stocks with a history of little price change over longer time periods, very high intraday volatility, very high daily volatility, and regular, big surprise moves. I stopped trading stocks some time ago, deciding to concentrate mainly on intraday trading the emini S&P 500 futures contract (ES) and the forex market. I tried this on some volatile stocks and exchange traded funds (ETFs). But the problem for an individual trader is that the more instruments you trade, the more difficult the followup. My opinion is you have to limit the number of instruments you trade, because even with a small amount, you still need to automate at least part of the trading process. Otherwise, you will miss trade opportunities and you will more easily make mistakes. I now trade the ES futures and the EUR/USD, GBP/USD, and GBP/ JPY forex pairs.The European Option Exchange (EOE) was founded in 1978 in Amsterdam as a futures and options exchange. I believe it was 1979 when an enthusiastic stock trading colleague at work talked to me about the possibility of trading options. He convinced me that this was the place to be — make a lot of money with little starting capital. With a group of other colleagues, we gathered some 400,000 Belgian francs (some 10,000 US dollars) to start an option investment club. I was going to make the trades based on technical analysis, and everybody would become rich in no time! A few months later, the money was gone. Luckily, we continued our meetings at a nearby Chinese restaurant, so it wasn’t all sad. Since then, I have been on what seems to be a never-ending quest to find the ideal way of trading the stock market based purely on technical analysis. After completing an investment and credit advisor course, I conducted many courses and presentations about technical analysis and options. The best thing about presenting a course is that as a teacher, you learn the most; many thanks to all who have attended my courses!
What type of process do you go through before making the decision to enter a trade?
I use the same basic chart template for trading forex and the ES. The ES eighttick modified renko chart in Figure 4 is constructed with this template. This template allows manual and full automated trading based on a strategy expert system. So the process I go through to make a buy decision is pretty much a standardized process. The modified renko chart is colorcoded by an expert system. Bars are green for a long position and black for a short position. Price moves within a volatility channel — denoted by the thicker magenta lines — and a faster, smaller channel, denoted by the thinner magenta lines. This is my band indicators expert system. Active support & resistance is based on 50- (blue), 100- (green), and 200- (red) period simple moving averages. Above and below the 50-period average (dotted light blue line), I use the same average but on the high and low price instead of the closing price. The trading strategy will use these lines as a longer-term reference to trade with the trend when there is a basic buy or sell signal from the expert system. The lower window has a fast and slow stochastic RSI indicator. It will give short- and longer-term information in relation to overbought or oversold conditions. The strategy also adds buttons in the upper toolbar that allow switching between manual and automatic trading and provides a number of practical tools. Looking at Figure 4, you see that, longer term, the index is moving in an uptrend, the averages are moving up, and after a swing reaction down, there is an expert buy signal around 14:37 (green bar). Since the closing of the bar is above the 50-period average of the low price, it will be accepted by the strategy and if in autotrading mode, an automated buy signal will be sent to the broker (together with a wider stop and target order). If the strategy is not in autotrading mode, you will have to decide if you want to take the trade or not using all available technical analysis techniques that may help you make the best possible decision. If you miss the first entry, you can use the light blue zigzag line to enter the trade after any short-term retracement (the green up arrows). This zigzag is based on a pullback retracement algorithm. Relying on the expert, if I were trading automatically, I would sell when the first black bar was evident on the chart. At that point, note that the ES was already in a trading range (horizontal brown bars). If I were trading manually I would probably wait and see what is coming next because there is support from a previous top and the 50-period average. At the last bar shown on the chart, the automated system would open a short position. I must mention that the strategy I used permits me to draw support, resistance, and trendlines acting as automated buy or sell signals either at a stop or limit price. That allows me, for example, to close a trade at a price target automatically or to open a trade at a limit price. You can say that the process I am going through to place a trade is either fully automated, semi-automated to open or close a trade, and a manual followup based on technical analysis or a manual process when I am in front of the screen. Specifically in forex trading, I am looking at a forex economic calendar to avoid trading when important events may create extreme volatility.
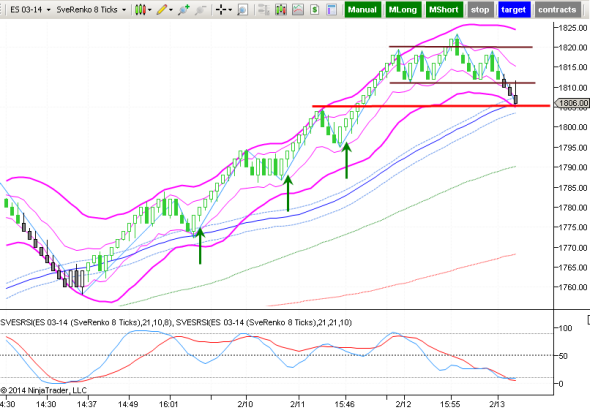
Figure 4: Opening a Trade.
S&C Interview: Next -Previous -Part 1 -Part 2 -Part 3 -
STOCATA Stocks Technical Analysis HOME
Links
Find a Stock ticker symbol, enter the ticker and find a chart, news, fundamentals and historical quotes.
Risk Disclosure: Futures and forex trading contains substantial risk and is not for every investor. An investor could potentially lose all or more than the initial investment. Risk capital is money that can be lost without jeopardizing ones’ financial security or life style. Only risk capital should be used for trading and only those with sufficient risk capital should consider trading. Past performance is not necessarily indicative of future results.
Hypothetical Performance Disclosure: Hypothetical performance results have many inherent limitations, some of which are described below. no representation is being made that any account will or is likely to achieve profits or losses similar to those shown; in fact, there are frequently sharp differences between hypothetical performance results and the actual results subsequently achieved by any particular trading program. One of the limitations of hypothetical performance results is that they are generally prepared with the benefit of hindsight. In addition, hypothetical trading does not involve financial risk, and no hypothetical trading record can completely account for the impact of financial risk of actual trading. for example, the ability to withstand losses or to adhere to a particular trading program in spite of trading losses are material points which can also adversely affect actual trading results. There are numerous other factors related to the markets in general or to the implementation of any specific trading program which cannot be fully accounted for in the preparation of hypothetical performance results and all which can adversely affect trading results.
See more 'Legal Disclosures' in the bottom menu bar!