
Latest News
2022 Start working on a new website
BBS Trading Expert
Watch the Youtube BBS video and here is a crude oil trading example
Want to know more about:
AXIOM business books awards, bronze medal! Thank You!
No longer available!
Favorite articles in 2010, 11, 12, 14 and 2015 S&C Readers' Choice Awards.

AXIOM Business Books Awards, bronze medal.

The Kirk Report Interview Part 4
The Kirk Report
Q&A With Sylvain Vervoort
Thursday, December 17, 2009 at 8:16 AM
Kirk Report Interview: Next -Previous -Part 1 -Part 2 -Part 3 -Part 4 -Part 5 -Part 6
-Part 7 -Part 8 -Part 9 -Part 10 -Part 11 -Part 12
Interviewed by Charles E. Kirk from "The Kirk Report"
Kirk: Most traders go through periods of exploring numerous indicators but eventually only use a handful or none at all. That doesn’t appear to be the case with you. Why do you think utilizing so many indicators works best?
Vervoort: From the thousands of indicators now available, I believe I am not using that many. Each indicator I use has a specific purpose. Let me clarify this further by showing you the daily chart setup I am using now with Metastock.
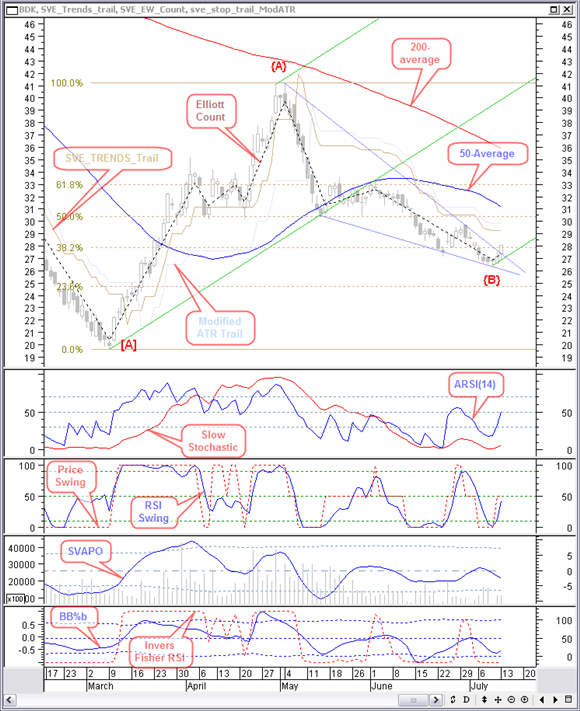
The upper window is the candle chart that will show me candle patterns. In there I have also standard 50-day and 200-day simple moving averages. This average shows resistance and support in the market. An indicator that helps me make an Elliott wave count is the black dashed Elliot count over the price candles. Whenever possible I will make use of Fibonacci targets and retracements, estimating support and resistance. And I will use a pitchfork, again mainly to estimate time-related price targets and support. And of course I will use normal support, resistance and trend lines. Still in this window you can see my modified ATR trailing stop and my TR&NDS trailing stop. Either one or the other, depending how fast I am planning to get out will be used as support, and a last warning signal to close the trade. I will use TR&NDS in for example an Elliott wave 1 or B, but a modified ATR trailing stop in an Elliott wave 3 or C.
In the second window below the main chart, I use my ARSI(14) indicator which is an asynchronous RSI that I use as a short-term entry or exit indicator. This indicator is fast and gives the most divergences. Overlaid in red I have a slow 50,3 stochastic. This one helps me to estimate the medium term price moves. Proprietary MetaStock indicators available to the public can be found on my website at this location.
In the third window I have an RSI-based fast swing oscillator. Together with ARSI, this indicator should give me fast entry or exit information. In red and dashed I have recently added a price swing oscillator. I can use it as a fast or as a rather slow indicator. Fast can point out extra information to support an entry. I use the slow one more as a selling indicator. The nice thing about this binary indicator with a value of 0 or 100 is that it is profitable on its own and I can make money both with long trades and short trades. This indicator is new and not yet available for public use.
In the fourth window is my SVAPO (Short Term Volume And Price Oscillator), together with volume bars. SVAPO is a more medium-term oscillator, with the advantage that it also takes volume into consideration. Turning points and divergences are very usable. Volume can confirm a move. SVAPO, like ARSI, has been published in Stocks & Commodities magazine.
In the last window I have my recently updated Bollinger bands %b indicator. An article about this indicator and the application has been submitted to S&C for publication. I have made use of the leading nature of the basic %b indicator to add a lot of smoothing creating much clearer turning points, while still being just fast enough. Most of the time there are useful divergences. This indicator will become available with an upcoming publication in S&C magazine. Finally, there is an inverse Fisher RSI function. This makes a nice binary visual buy and sell indicator. It can be set fast or slow. Although it is not yet finished, it will probably be another indicator to be published in an upcoming issue of S&C magazine.
Kirk: That’s still a lot of indicators to track though I’m sure you find it helpful to have each in the way you’ve laid it out on your chart template. The first question that probably will come to the mind of anyone reviewing your chart layout is how you deal with conflicting information generated by each indicator. How do you resolve those conficts and are there some indicators that take priority over others in terms of importance?
Vervoort: Let’s look at the previous daily chart setup to see if this is the case.
You can see in the chart of Black & Decker (BDK) on July 13, 2009 that a longer term downtrend price made a bottom at the beginning of March. So this is either the end of the correction with a wave C or just the first wave A of that correction. At that point it is not important because we are expecting an upward move, either a new wave 1 or a correction wave B.
At the top end of April, you can see a black hammer confirmed with a black candle down. Price is finding resistance against the 200-day simple moving average. At that point there is a small negative divergence in ARSI while the slow stochastic is topping. The RSI swing is turning down from the 100-level, SVAPO is turning down with a big negative divergence and the BB%b indicator has turned down as a leading indicator a number of days before. The price swing and the inverse Fisher RSI are both in selling territory. Volume is also confirming an ABC correction move where the A and C waves were created with higher volume, but the correction at the beginning of April had lower volume. So there is in my opinion no contradiction. On the contrary, everything points in the direction of a downward reversal.
Now, on July 13th, price clearly made an intermediate correction wave and is probably finishing a B-wave or a 2-wave. The price found support and resistance at the 50-day simple moving average. Once more it was not important because in both cases what we expect next is an upward move. And in both cases a new top above the previous {A} wave.
Is July 13 a good buying day? Are there any contradictions?
In the candle chart we have a bullish engulfing pattern, confirmed with another white candle. The closing price of this last candle is now breaking the downtrend line. An inverse trend line through the bottom makes a falling wedge pattern. Breaking out to the upper side of this pattern here makes it a continuation pattern from the previous uptrend. Price is now past the 38.2% Fibonacci retracement level, so it is a big 61.8% correction of the previous up move. Drawing the possible green pitchfork gives you the median line as a target in 80% of the cases.
ARSI is making a positive divergence with price, while the slow stochastic is making a second bottom. The RSI swing oscillator is turning up from the bottom. And also the BB%b indicator is turning up again with a positive divergence. Only SVAPO and volume do not yet seem to follow, but we know that they can be a little slow. If SVAPO turns up next, there will also be a positive divergence with price. Price swing and inverse Fisher RSI are in the buying area.
Again almost everything points in the direction of the start of a new upward move. No contradictions!
The risk-to-reward ratio is also very important. With a closing price initial stop at $26.44, the last low point, and buying now at $28.06 with a minimum price target above the previous top at around $42, there is a possible loss of about 7%, but a potential profit of more than 50%. This is not a bad entry point and a long position you should not miss.
The highest price up to December 8 has been $63.58. Of course during the up move you will need to decide what to do at certain levels based on your basic targets, swing trading, medium-term or long term-trading.
Kirk Report Interview: Next -Previous -Part 1 -Part 2 -Part 3 -Part 4 -Part 5 -Part 6
-Part 7 -Part 8 -Part 9 -Part 10 -Part 11 -Part 12
STOCATA Stocks Technical Analysis HOME
Links
Find a Stock ticker symbol, enter the ticker and find a chart, news, fundamentals and historical quotes.
Risk Disclosure: Futures and forex trading contains substantial risk and is not for every investor. An investor could potentially lose all or more than the initial investment. Risk capital is money that can be lost without jeopardizing ones’ financial security or life style. Only risk capital should be used for trading and only those with sufficient risk capital should consider trading. Past performance is not necessarily indicative of future results.
Hypothetical Performance Disclosure: Hypothetical performance results have many inherent limitations, some of which are described below. no representation is being made that any account will or is likely to achieve profits or losses similar to those shown; in fact, there are frequently sharp differences between hypothetical performance results and the actual results subsequently achieved by any particular trading program. One of the limitations of hypothetical performance results is that they are generally prepared with the benefit of hindsight. In addition, hypothetical trading does not involve financial risk, and no hypothetical trading record can completely account for the impact of financial risk of actual trading. for example, the ability to withstand losses or to adhere to a particular trading program in spite of trading losses are material points which can also adversely affect actual trading results. There are numerous other factors related to the markets in general or to the implementation of any specific trading program which cannot be fully accounted for in the preparation of hypothetical performance results and all which can adversely affect trading results.
See more 'Legal Disclosures' in the bottom menu bar!