
Latest News
2022 Start working on a new website
BBS Trading Expert
Watch the Youtube BBS video and here is a crude oil trading example
Want to know more about:
AXIOM business books awards, bronze medal! Thank You!
No longer available!
Favorite articles in 2010, 11, 12, 14 and 2015 S&C Readers' Choice Awards.

AXIOM Business Books Awards, bronze medal.

The Kirk Report Interview Part 7
The Kirk Report
Q&A With Sylvain Vervoort
Thursday, December 17, 2009 at 8:16 AM
Kirk Report Interview: Next -Previous -Part 1 -Part 2 -Part 3 -Part 4 -Part 5 -Part 6
-Part 7 -Part 8 -Part 9 -Part 10 -Part 11 -Part 12
Interviewed by Charles E. Kirk from "The Kirk Report"
Did we reach the closing target? Or did we have to get out with the trailing stop? You can see here what happened next:
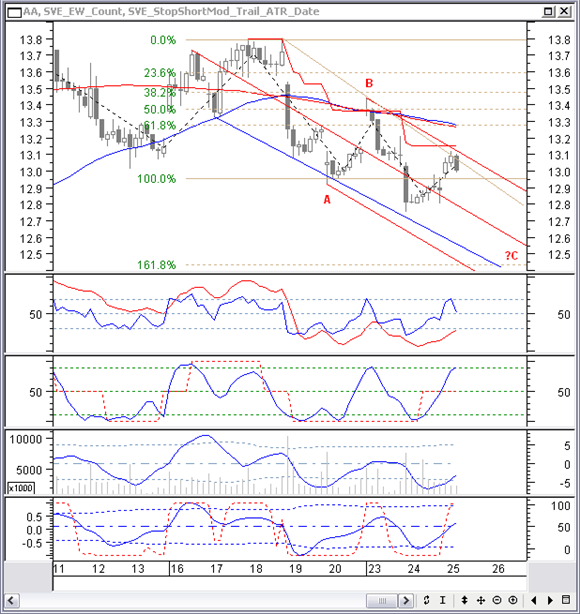
It looks like we are having an extension in the C-wave with another lower degree zigzag. I am also moving the pitchfork reference origin to a previous top, to make it less steep and moving in line with price. Now it is also in line with the downtrend line and the inverse trend line. The short term ARSI indicator is already turning down and the RSI swing is making a top, ready to turn down. The price is close to the trailing stop, but it finds resistance from the upper side of the pitchfork and from the downtrend line. So, I expect further downward movement.
Did we finally reach the target? Let’s see:
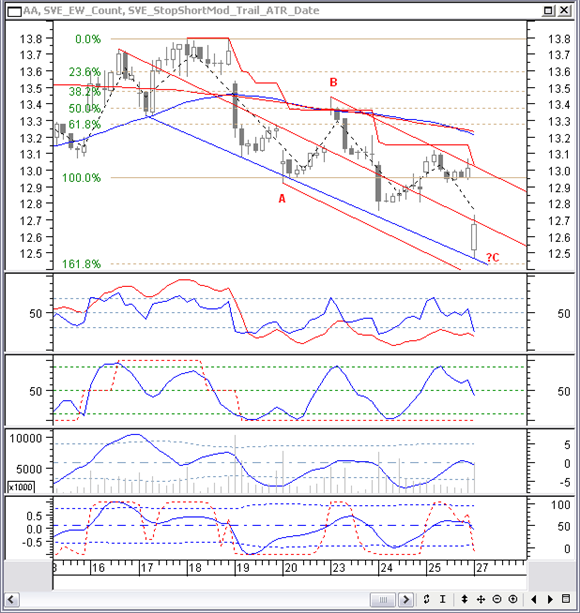
On November 27 the first hour after the opening there was a low price of $12.46 and my position was closed at $12.55. That made a profit of more than 8% in just 7 days.
Regrettably, sometimes I am too eager to take a trade.
On June 23, 2009 I bought Usg (USG) at $9.95 as you can see the daily chart on that date:
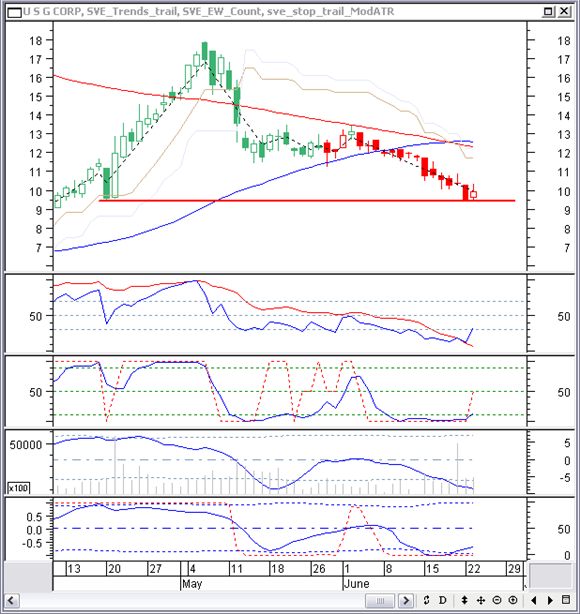
I have the initial closing stop at $13.8. Since price is probably finishing an upward move, I am expecting an Elliot correction wave. In most cases an ABC zigzag pattern. I have no future turning point yet to make a Fibonacci projection, but what I do then is use what I call a historical projection, using a previous turning point. That will most likely show support for future prices and probably be usable as a reference point for my projection. That gives a target price around $12.55.
All indicators are in the buying area and most of them are turning up already, while a previous support is confirmed with a bullish harami candlestick pattern. The first resistance of the averages is 20% away and buying at $9.55. I could use a close initial stop setting at $9.30.
Let’s now follow up with this chart:
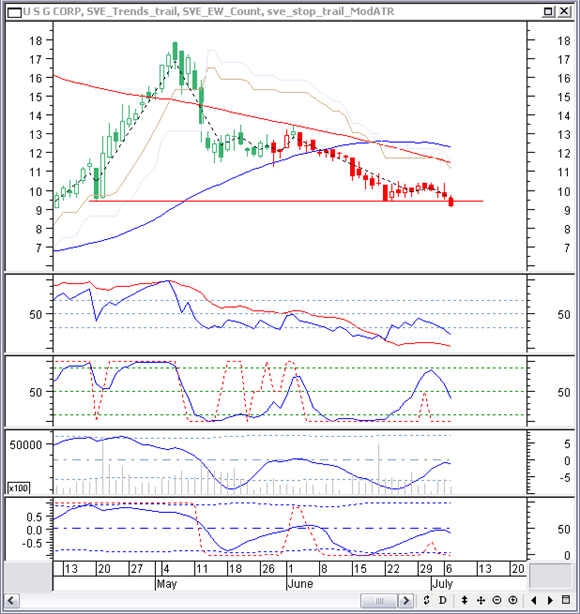
Actually, already the next day there was a bad sign. The bullish harami pattern was not confirmed and finally on July 7, the initial stop was broken and the position was closed with a loss of about 2.5%. Lesson? Do not trade on a pattern that needs confirmation if you do not have that confirmation yet.
Kirk Report Interview: Next -Previous -Part 1 -Part 2 -Part 3 -Part 4 -Part 5 -Part 6
-Part 7 -Part 8 -Part 9 -Part 10 -Part 11 -Part 12
STOCATA Stocks Technical Analysis HOME
Links
Find a Stock ticker symbol, enter the ticker and find a chart, news, fundamentals and historical quotes.
Risk Disclosure: Futures and forex trading contains substantial risk and is not for every investor. An investor could potentially lose all or more than the initial investment. Risk capital is money that can be lost without jeopardizing ones’ financial security or life style. Only risk capital should be used for trading and only those with sufficient risk capital should consider trading. Past performance is not necessarily indicative of future results.
Hypothetical Performance Disclosure: Hypothetical performance results have many inherent limitations, some of which are described below. no representation is being made that any account will or is likely to achieve profits or losses similar to those shown; in fact, there are frequently sharp differences between hypothetical performance results and the actual results subsequently achieved by any particular trading program. One of the limitations of hypothetical performance results is that they are generally prepared with the benefit of hindsight. In addition, hypothetical trading does not involve financial risk, and no hypothetical trading record can completely account for the impact of financial risk of actual trading. for example, the ability to withstand losses or to adhere to a particular trading program in spite of trading losses are material points which can also adversely affect actual trading results. There are numerous other factors related to the markets in general or to the implementation of any specific trading program which cannot be fully accounted for in the preparation of hypothetical performance results and all which can adversely affect trading results.
See more 'Legal Disclosures' in the bottom menu bar!