
Latest News
2022 Start working on a new website
BBS Trading Expert
Watch the Youtube BBS video and here is a crude oil trading example
Want to know more about:
AXIOM business books awards, bronze medal! Thank You!
No longer available!
Favorite articles in 2010, 11, 12, 14 and 2015 S&C Readers' Choice Awards.

AXIOM Business Books Awards, bronze medal.

The Kirk Report Interview Part 5
The Kirk Report
Q&A With Sylvain Vervoort
Thursday, December 17, 2009 at 8:16 AM
Kirk Report Interview: Next -Previous -Part 1 -Part 2 -Part 3 -Part 4 -Part 5 -Part 6
-Part 7 -Part 8 -Part 9 -Part 10 -Part 11 -Part 12
Interviewed by Charles E. Kirk from "The Kirk Report"
Kirk: That was a good example to show us what you look for and the indicators you use. While I think it would not be correct to suggest that every situation lines up exactly the way this one did, I think people will find it of interest. As for further clarification, are there indicators you have used in the past that you don’t use now?
Vervoort: Yes, because there are new indicators all the time and I am making my own indicators. So, logically if I find some new indicator gives me a better result, I will change it. On the other hand once you have a set of indicators you are used to and which help you to perform well, you are often reluctant to change. That’s natural.
Kirk: Tell us a bit about your indicator SVAPO. Most charting platforms (Stock Finder, Esignal, Metastock, etc.) have the ability to import this indicator.
Vervoort: SVAPO is a short-term oscillator based on price and volume, so the first thing I did was look at the relationship between these two components in up- and down-trending and down trending markets. These are their normal relationships:
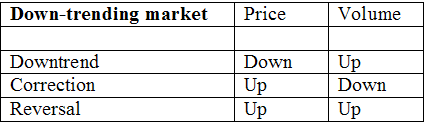
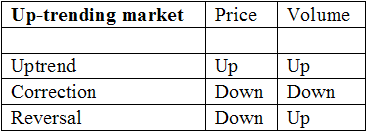
Combining the relationships based on market direction leaves us with three possible conditions: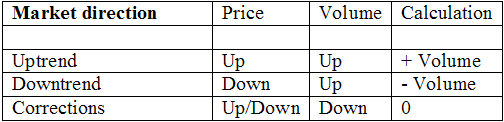
In an up-trending market, price and volume are moving up. When calculating the oscillator, I will be adding volume. In a down-trending market, the price goes down, while the volume is up. When calculating the oscillator, I will subtract volume. When the volume is moving down and the price is in a consolidation phase moving in either direction, the volume will not be taken into consideration when calculating the oscillator.
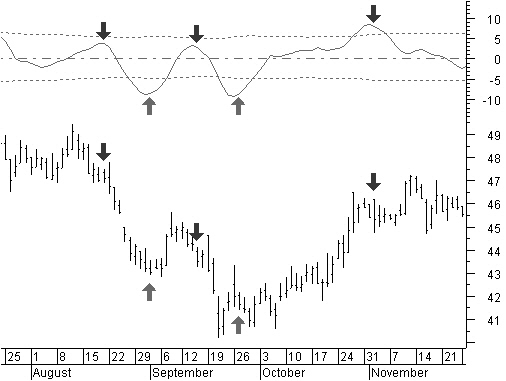
Of course, merely combining price and volume will result in a very choppy oscillator. Using conventional smoothing techniques, such as standard moving averages, would create an unacceptable delay for a short-term oscillator. I use a number of different techniques to come up with a smooth but still fast oscillator.
In the chart that follows you can see the SVAPO oscillator in action. Many times, just using the turning points in the oscillator yields profitable trades and it is useful to spot the divergences which occur between the oscillator and the stock’s price.
Kirk: Very good. I think that will likely encourage some who read this to seek out that indicator for their charting platform!
In the book you also stress viewing charts from different time periods. What are the time frames you most often look at, and what are some examples of times you think multiple time period analysis is important?
Vervoort: When trading medium to long term on the level of daily charts, for example, I will look at a weekly chart or even a monthly chart to find out which longer term Elliott wave the stock is in. Also, are the indicators on the weekly chart in an up or down move or close to a turning point? Any decision on a daily chart in the same direction will have a better chance for success. Let me show you the chart of Black & Decker (BDK) again but now with weekly candles.
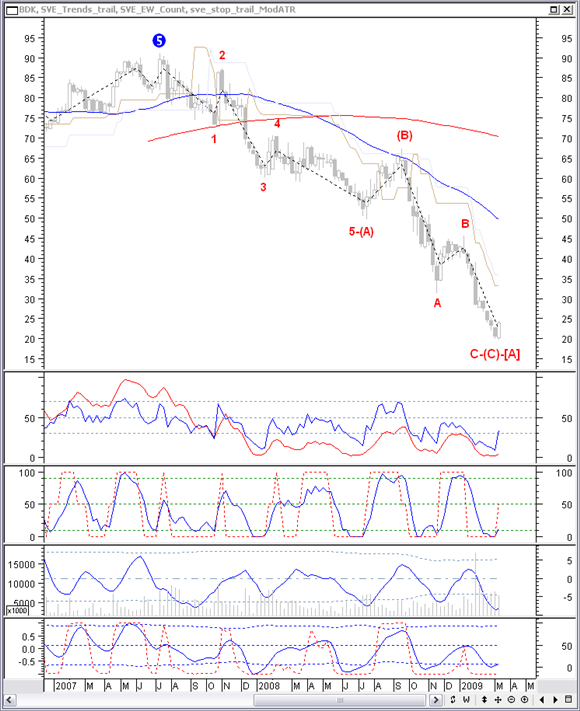
The July 2007 price made a top and therefore presumably an Elliott wave top 5. As of March 13, 2009 price made a big ABC correction, with an impulse wave for wave A, correction wave B and a correction wave C down, more or less in relation to the size of the A wave. If this is a turning point, what do we expect? A new long-term impulse wave 1 up or a correction wave B up. And now there is a bullish engulfing pattern in the candle chart and all indicators are turning up in the buying area.
It’s time to have a look at the daily chart.
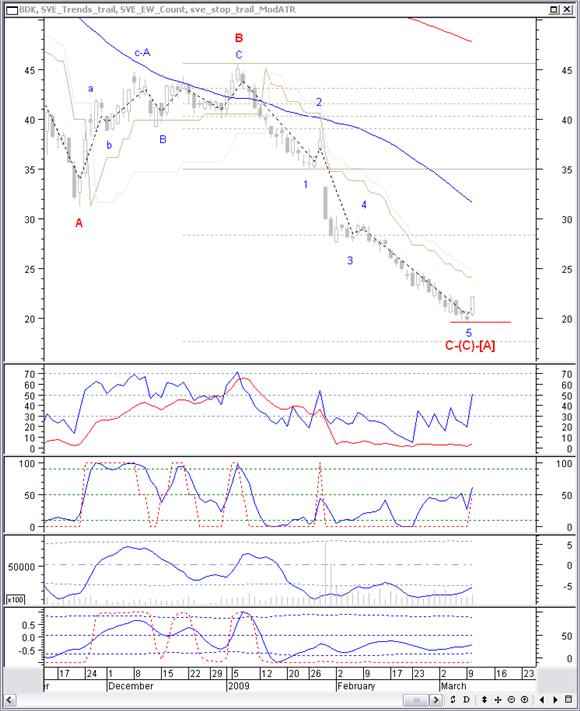
Let’s even go a few days earlier to March 10, to see what was already clear in the daily chart. In the candle chart we have a nice morning star bottom reversal pattern close to the Fibonacci target price at 261.8%. The last intermediate Elliott wave C is apparently completed with an impulse wave down. Each indicator is showing a divergence with price and inverse Fisher are in the buying area. We shouldn’t forget that the long term as seen on the weekly chart is ready to turn. Buying now there is no nearby resistance and we are probably at the start of a longer-term up move. With a closing price stop at the low point of the morning star we have a very good risk-to-reward ratio. Of course you can go one step further and follow up this stock in this period on an hourly basis. You will certainly end up with an even better initial stop setting.
Kirk Report Interview: Next -Previous -Part 1 -Part 2 -Part 3 -Part 4 -Part 5 -Part 6
-Part 7 -Part 8 -Part 9 -Part 10 -Part 11 -Part 12
STOCATA Stocks Technical Analysis HOME
Links
Find a Stock ticker symbol, enter the ticker and find a chart, news, fundamentals and historical quotes.
Risk Disclosure: Futures and forex trading contains substantial risk and is not for every investor. An investor could potentially lose all or more than the initial investment. Risk capital is money that can be lost without jeopardizing ones’ financial security or life style. Only risk capital should be used for trading and only those with sufficient risk capital should consider trading. Past performance is not necessarily indicative of future results.
Hypothetical Performance Disclosure: Hypothetical performance results have many inherent limitations, some of which are described below. no representation is being made that any account will or is likely to achieve profits or losses similar to those shown; in fact, there are frequently sharp differences between hypothetical performance results and the actual results subsequently achieved by any particular trading program. One of the limitations of hypothetical performance results is that they are generally prepared with the benefit of hindsight. In addition, hypothetical trading does not involve financial risk, and no hypothetical trading record can completely account for the impact of financial risk of actual trading. for example, the ability to withstand losses or to adhere to a particular trading program in spite of trading losses are material points which can also adversely affect actual trading results. There are numerous other factors related to the markets in general or to the implementation of any specific trading program which cannot be fully accounted for in the preparation of hypothetical performance results and all which can adversely affect trading results.
See more 'Legal Disclosures' in the bottom menu bar!