
Latest News
2022 Start working on a new website
BBS Trading Expert
Watch the Youtube BBS video and here is a crude oil trading example
Want to know more about:
AXIOM business books awards, bronze medal! Thank You!
No longer available!
Favorite articles in 2010, 11, 12, 14 and 2015 S&C Readers' Choice Awards.

AXIOM Business Books Awards, bronze medal.

The Kirk Report Interview Part 10
The Kirk Report
Q&A With Sylvain Vervoort
Thursday, December 17, 2009 at 8:16 AM
Kirk Report Interview: Next -Previous -Part 1 -Part 2 -Part 3 -Part 4 -Part 5 -Part 6
-Part 7 -Part 8 -Part 9 -Part 10 -Part 11 -Part 12
Interviewed by Charles E. Kirk from "The Kirk Report"
Kirk: Not bad. So, what are some key things you’ve learned about proper backtesting trading strategies?
Vervoort: I think you always have to use the same basic setup to be able to compare. Also, when the result is too beautiful to be true, something is certainly not right! I will verify the result on a number of charts, to make sure the result visually looks as expected. I will also use different markets and a bigger number of stocks to make sure the result is consistent.
Kirk: Are there any traps investors should try to avoid when backtesting?
Vervoort: In general I would warn about optimizing. Use an average for the parameters. Find that average in an older period and then test consistency in a later period. Of course, be very careful with indicators like the zigzag function in MetaStock, which uses foresight. Finally, always keep an eye on a number of charts to verify the correctness of the result.
Kirk: Speaking of backtesting and strategy development, I understand you are developing a mechanical strategy called SATS2. While I know from our previous conversations that this strategy is still under development, can you tell us what your goals are with this new system?
Vervoort: The goal is simple – create a fully automatic trading system that makes money while you are on vacation. Is that not the dream of every trader? SATS2 is a step in that direction. I am not using SATS2 as an automatic system, rather as an expert indication on my charts giving the buy and sell signals. The main utility for me is that I know that it can make money on its own and that I can use it as a confirmation or to synchronize trading.
For the moment there are some people using it for real-time testing. In the mean time I also have a SATS3 and SATS4 and I am working on a SATS5 system which looks promising at least for the moment. All systems use a different approach. That way you can eventually use the different systems at the same time, averaging the result.
Kirk: Based on your backtesting, what’s the future potential for SATS2? As you know, you were kind enough to provide me access to SATS2 and my own testing confirms that you are definitely onto something with this approach.
Vervoort: Let me show you some results for the different systems I have for the moment. I will be using exactly the same conditions for each system, so you can compare results.
I am testing the period beginning 2004 till December 2009. Looking at the following chart you can see what the S&P 500 index was doing. Actually a buy and hold in that period with the S&P500 would not have given any profit.
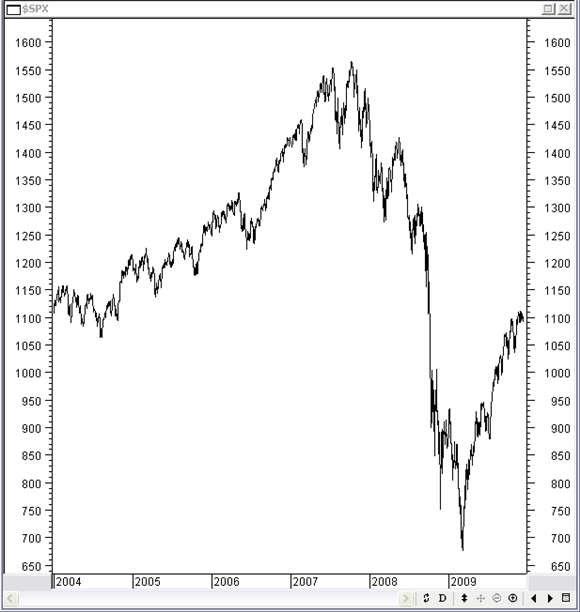
But as I mentioned before I am looking for stocks that make large price moves over longer periods while avoiding stocks that have a history of:
- Little price change over a longer periods
- Very high intraday volatility
- Very high daily volatility
- Regular big surprise moves
I repeat these criteria because this is an important part of being successful with any automatic trading system. In most systems, there will be some kind of trend following. You can imagine that with a stock that moves 10 to 20% it is impossible to make money following that trend. You need bigger moves. I am doing the test here with 31 stocks. Starting capital is $1000 per stock, no profit or loss sharing, 0.2% cost for entry and exit. Trades are without delay at the closing price on the signal day. Long trades only.
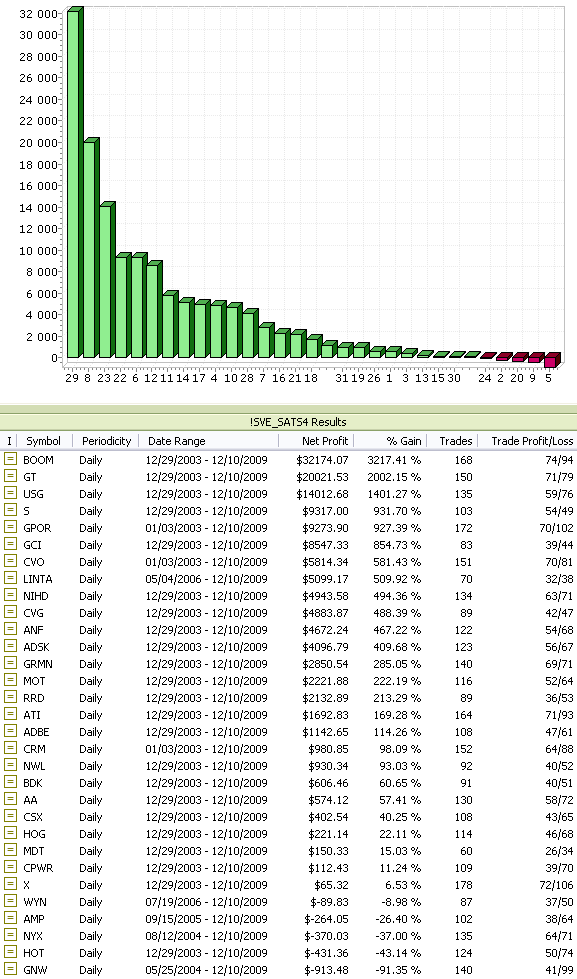
What are the results for each system? Take a look each system’s performance separately through the next 3 pictures for SATS2, SATS3 and SATS4.
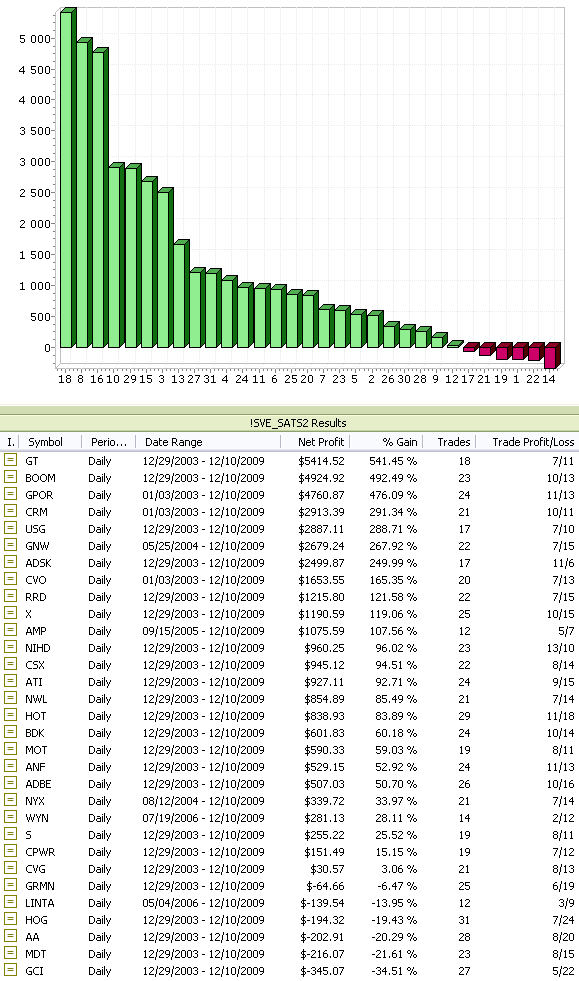
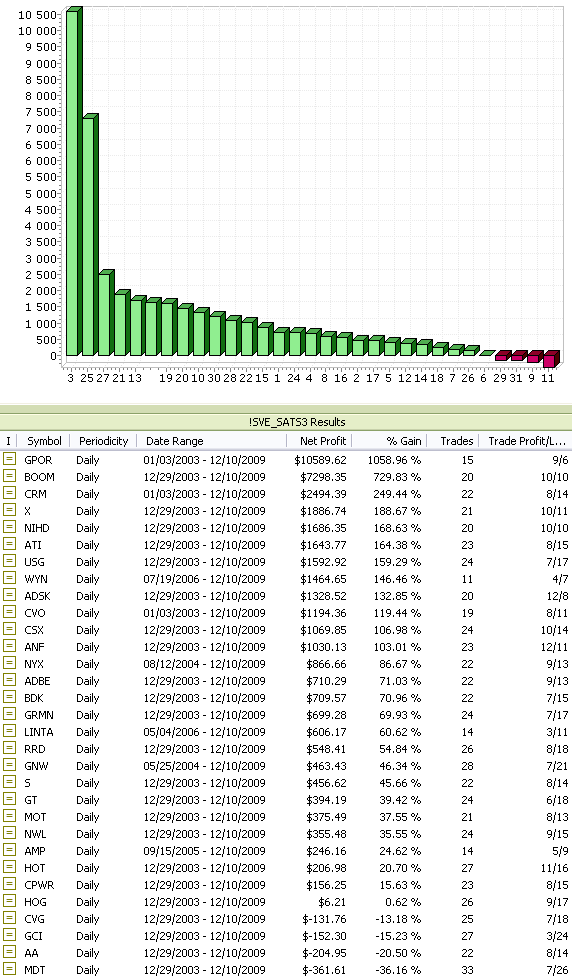
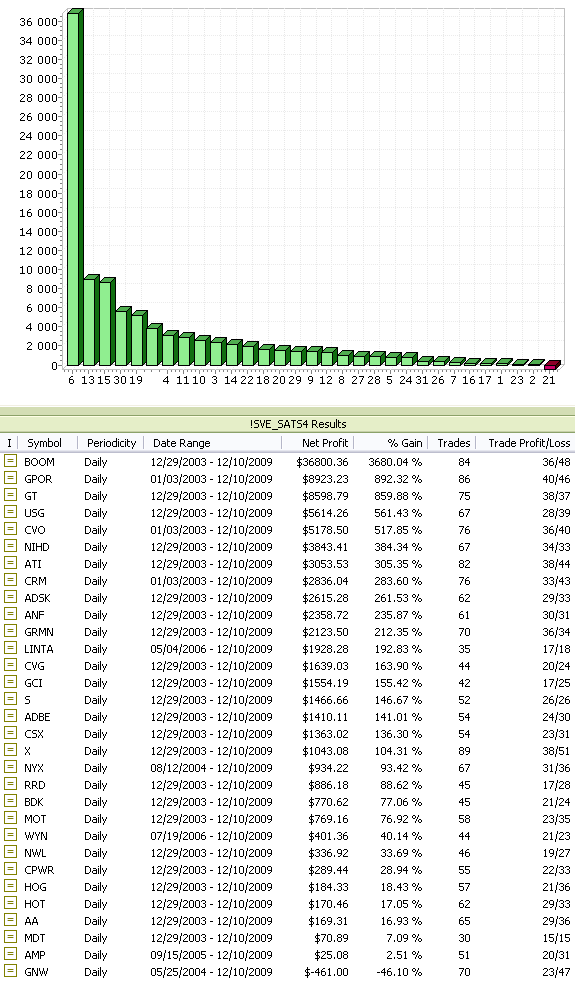
As you can see from that data, SATS2 makes a total profit of 122.15% with an average of 21 trades. SATS3 makes a total profit of 126.55% with an average of 22 trades. SATS4 makes a total profit of 312.57% with an average of 60 trades. The best stock here makes an extreme profit, but even if we would attribute a more moderate gain for that stock, the profit will be well over 200%.
SATS4 is also the only system that could be used continuously for both long and short positions. In the next picture you can see the result trading long and short with SATS4. Here there is a total profit of +435% with 120 trades on average. The goal of course is that the ideas behind SATS5 will still generate even more profit!
Kirk Report Interview: Next -Previous -Part 1 -Part 2 -Part 3 -Part 4 -Part 5 -Part 6
-Part 7 -Part 8 -Part 9 -Part 10 -Part 11 -Part 12
STOCATA Stocks Technical Analysis HOME
Links
Find a Stock ticker symbol, enter the ticker and find a chart, news, fundamentals and historical quotes.
Risk Disclosure: Futures and forex trading contains substantial risk and is not for every investor. An investor could potentially lose all or more than the initial investment. Risk capital is money that can be lost without jeopardizing ones’ financial security or life style. Only risk capital should be used for trading and only those with sufficient risk capital should consider trading. Past performance is not necessarily indicative of future results.
Hypothetical Performance Disclosure: Hypothetical performance results have many inherent limitations, some of which are described below. no representation is being made that any account will or is likely to achieve profits or losses similar to those shown; in fact, there are frequently sharp differences between hypothetical performance results and the actual results subsequently achieved by any particular trading program. One of the limitations of hypothetical performance results is that they are generally prepared with the benefit of hindsight. In addition, hypothetical trading does not involve financial risk, and no hypothetical trading record can completely account for the impact of financial risk of actual trading. for example, the ability to withstand losses or to adhere to a particular trading program in spite of trading losses are material points which can also adversely affect actual trading results. There are numerous other factors related to the markets in general or to the implementation of any specific trading program which cannot be fully accounted for in the preparation of hypothetical performance results and all which can adversely affect trading results.
See more 'Legal Disclosures' in the bottom menu bar!