
Latest News
2022 Start working on a new website
BBS Trading Expert
Watch the Youtube BBS video and here is a crude oil trading example
Want to know more about:
AXIOM business books awards, bronze medal! Thank You!
No longer available!
Favorite articles in 2010, 11, 12, 14 and 2015 S&C Readers' Choice Awards.

AXIOM Business Books Awards, bronze medal.

The Kirk Report Interview Part 11
The Kirk Report
Q&A With Sylvain Vervoort
Thursday, December 17, 2009 at 8:16 AM
Kirk Report Interview: Next -Previous -Part 1 -Part 2 -Part 3 -Part 4 -Part 5 -Part 6
-Part 7 -Part 8 -Part 9 -Part 10 -Part 11 -Part 12
Interviewed by Charles E. Kirk from "The Kirk Report"
Kirk: What are your plans for SATS2 and the other strategies?
Vervoort: At this point, I have completed the documentations to SATS2 including ideas to avoid SATS2 losing trades and a technique to profit from stock down moves with put options. However, SATS3 and SATS4 are not documented yet. I’m still in the early stages of developing SATS5 as I still have to work on the formulas.
Kirk: Is it your goal to completely automate more of your trading in the years to come?
Vervoort: That is not the plan for now, but it is something to think about. I would like to try it out on real time FOREX trading if I can find some free time. Additionally, trading very short time periods requires some different techniques.
Kirk: What are the potential advantages and disadvantages to mechanical trading strategies versus discretionary trading approaches?
Vervoort: A full automatic mechanical trading system (for example on the Emini) can run and make profit 24 hours a day, without any human intervention or emotion.
Using mechanical signals, but trading discretionarily has the advantage that it can take out a great deal of emotion if you are convinced that the system on its own is profitable. So, you would concentrate on avoiding losing trades that are proposed by the system and eventually close some trades early for more profit. Let me show an example with SATS2:
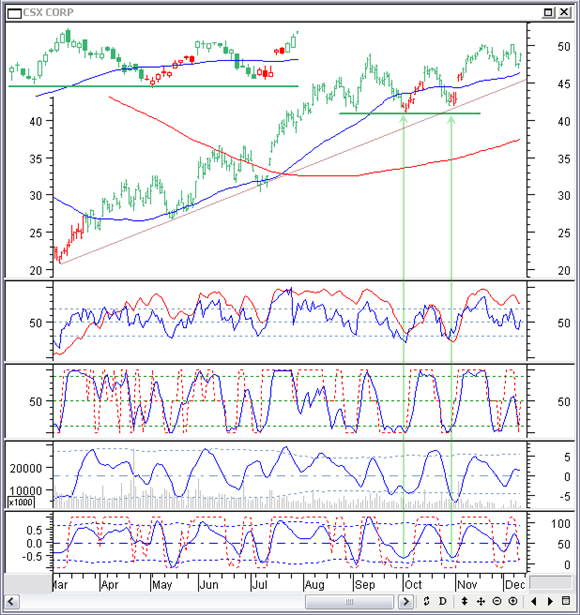
In Csx (CSX) there was a SATS2 buying signal on March 24, 2009 (the first green bar after a red bar). A first selling signal appears on October 1, 2009 (the first red bar after a green bar). You can see a detailed candlestick figure in the top left corner in the chart above. Trading automatically would mean that SATS2 is selling. However since I am not using it that way, I have the chance to have a look at the chart before eventually closing the position.
Here you can see that price is turning exactly at the support of a previous turning point (a morning doji star pattern). Also all indicators are in the buying area. Price is close to the support of the medium term uptrend line. That is reason enough to hold on to the position and keep a stop at the level of the support line or the uptrend line. Neither of them are broken and two days later you can recognize a morning star pattern, confirming the up reversal.
On October 29 there is another selling signal, but, applying the same reasoning, I would stay in the trade here also. That way I am avoiding two trades that would cost me money.
Kirk: In other words, the system would provide a general framework, but then you’d apply your technical analysis skills to determine which signals to pay attention to and which ones to overrule. Very crafty I must say, and a strategy I would think would increase your odds of success.
In terms of an overall trading strategy development, will you provide some specific suggestions about things to do and to not do that your research has found to be particularly helpful over the years?
Vervoort: The most important things in technical analysis remain the most basic and simple things like support and resistance, trend lines, simple moving averages, and, on real time charts, pivot points.
Let me put it this way; if you are experienced in drawing trend lines and using support and resistance, try to beat the system that is simply buying and selling on trend line breaks.
Kirk: So what do you feel is the best way to learn technical analysis?
Vervoort: Learn every individual technique and practice with historical data. Advance the data bar by bar, make buy and sell decisions. Are you making money? No? Keep practicing. And, of course, visit my website and buy my book. All the techniques and rules you need to know about are in there.
Kirk: How did you go about learning about each indicator and finding a way to apply it to your trading?
Vervoort: To start with, a lot of indicators are quite similar. So I just put the new one over an existing one. If there is one that looks promising, I will compare it with an indicator I am using already and start looking at a number of charts and periods to be able to decide which one is more reliable and gives better signals.
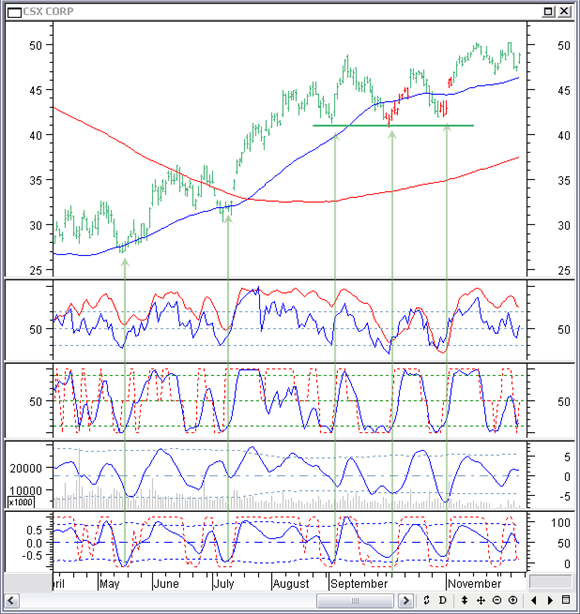
But as you have noticed already, I am now mainly using my own indicators. I like clear turning points and divergences to make the decision as easy and as reliable as possible. Looking at CSX again in the chart below, it is easy to recognize the possible entry points in the upward move. Almost always the indicators are at a low point and turning up, eventually showing normal or hidden divergence:
Kirk Report Interview: Next -Previous -Part 1 -Part 2 -Part 3 -Part 4 -Part 5 -Part 6
-Part 7 -Part 8 -Part 9 -Part 10 -Part 11 -Part 12
STOCATA Stocks Technical Analysis HOME
Links
Find a Stock ticker symbol, enter the ticker and find a chart, news, fundamentals and historical quotes.
Risk Disclosure: Futures and forex trading contains substantial risk and is not for every investor. An investor could potentially lose all or more than the initial investment. Risk capital is money that can be lost without jeopardizing ones’ financial security or life style. Only risk capital should be used for trading and only those with sufficient risk capital should consider trading. Past performance is not necessarily indicative of future results.
Hypothetical Performance Disclosure: Hypothetical performance results have many inherent limitations, some of which are described below. no representation is being made that any account will or is likely to achieve profits or losses similar to those shown; in fact, there are frequently sharp differences between hypothetical performance results and the actual results subsequently achieved by any particular trading program. One of the limitations of hypothetical performance results is that they are generally prepared with the benefit of hindsight. In addition, hypothetical trading does not involve financial risk, and no hypothetical trading record can completely account for the impact of financial risk of actual trading. for example, the ability to withstand losses or to adhere to a particular trading program in spite of trading losses are material points which can also adversely affect actual trading results. There are numerous other factors related to the markets in general or to the implementation of any specific trading program which cannot be fully accounted for in the preparation of hypothetical performance results and all which can adversely affect trading results.
See more 'Legal Disclosures' in the bottom menu bar!