
Latest News
2022 Start working on a new website
BBS Trading Expert
Watch the Youtube BBS video and here is a crude oil trading example
Want to know more about:
AXIOM business books awards, bronze medal! Thank You!
No longer available!
Favorite articles in 2010, 11, 12, 14 and 2015 S&C Readers' Choice Awards.

AXIOM Business Books Awards, bronze medal.

The Kirk Report Interview Part 9
The Kirk Report
Q&A With Sylvain Vervoort
Thursday, December 17, 2009 at 8:16 AM
Kirk Report Interview: Next -Previous -Part 1 -Part 2 -Part 3 -Part 4 -Part 5 -Part 6
-Part 7 -Part 8 -Part 9 -Part 10 -Part 11 -Part 12
Interviewed by Charles E. Kirk from "The Kirk Report"
Kirk: I have been using stochastics/rsi (various time frames) in conjunction with modified ATR trailing stops. In essence, I try to buy pullback setups in a stock that holds above its ATR and which is oversold providing for a good risk/reward setup. If the stock moves lower and breaks the ATR, I’m out. Your thoughts on this basic hybrid approach?
Vervoort: I will use the following to give you my thoughts about this:
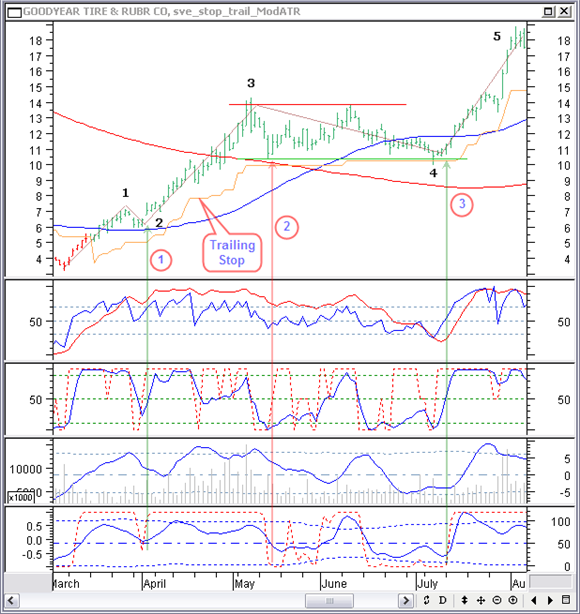
In an upward move the main pullbacks will be Elliott correction waves 2 and 4. In general wave 2 will not retrace the stochastics/RSI to the oversold area. You can see this at (1). But if you were looking to enter at the start of wave 3, the most interesting thing here is that the price pulled back to the 50-day simple moving average and started to turn up from that same level while you can see turning points in other indicators. Wave 4 here is a flat correction with a first pullback at (2) to the trailing ATR stop at the beginning of May. Also here you can see the support of the 200-day simple moving average in action. The question is, should you buy here? I would not. The indicators have clearly not finished their downward move. There is no sign of an ABC Elliott correction which I would expect here. After a 200% upward move I expect a longer consolidation period.
The pullback (3) at the beginning of July looks much more interesting. Here I would buy. Price is falling back and turning on a previous (green) support line. The price finishes an Elliott flat ABC correction. All indicators are turning up from the oversold area and most of them with positive divergences. Price is also turning at the lower side of a rectangular price pattern, most probably to become a continuation pattern. And, as I have mentioned a few times, I would close the trade based on technical analysis and only keep the trailing stop as a last warning signal to close the trade.
Kirk: Great! After introducing the ATR stop to many people here at The Kirk Report, your thoughts on how this indicator is useful amidst a trading strategy and in combination with other analyses is helpful. We appreciate it.
Now, let’s move on to another topic I know is important to you: backtesting! Verifying your approach based on historical analysis certainly appears to be a significant part of your research and your trading edge. How do you backtest indicators and strategies you develop?
Vervoort: If some idea comes up, I will always try to write a formula for it to be able to do some automatic testing with the system tester in MetaStock. As much as possible I will use the same stocks and periods and, of course, the same testing conditions. That way I can compare results of other ideas to find out if this one is better or worse. Sometimes it will be very difficult to write code for the idea. Then I will go manually through a number of charts to verify if it is worth pursuing the idea further.
Kirk: If possible, can you provide an example of a simple backtest and the steps you took to verify the profitability of a specific strategy?
Vervoort: In my book there is a section about finding fast reliable moving average crossovers. Here I am using the cross-over between a zero-lagging TEMA average on the typical price with the zero-lagging TEMA average on the average heikin ashi closing price. It is probably the only averages cross-over system that I know that remains profitable in the long run.
First you create the buy and sell conditions in the MetaStock system tester.
Buy condition:
avg:= 65;
EMA1:= Tema((H+L+C)/3,avg);
EMA2:= Tema(EMA1,avg);
Difference:= EMA1 – EMA2;
ZlCl:= EMA1 + Difference;
haOpen:=(Ref((O+H+L+C)/4,-1) + PREV)/2;
haC:=((O+H+L+C)/4+haOpen+Max((O+H+L+C)/4,Max(H,haOpen))+Min((O+H+L+C)/4,Min(L,haOpen)))/4;
EMA1:= Tema(haC,avg);
EMA2:= Tema(EMA1,avg);
Difference:= EMA1 – EMA2;
ZlHa:= EMA1 + Difference;
Cross(ZlCl,ZlHa)
Sell condition:
Completely the same except that the for the last statement the crossing would be the other way around with: Cross(ZlHa,ZlCl).
Then I select, in my case, 25 volatile stocks within the time period 01/16/2003 till 11/09/2007. Because of the longer run in period for the TEMA average, first buy signals will only appear from mid 2004. So we are looking at about 3 years of trading.
The 25 selected stocks used are: AIRM, AKAM, AMD, ANF, ATI, AYE, BGC, BRCM, CRDN, CVO, EBAY, FTO, ILMN, INTC, MED, MIND, NCR, NVDA, SNDK, SPNC, TRE, TWTC, VPHM, WFR, X.
Finally you have to set the test conditions. Here they are:
$1,000 capital per stock with no profit or loss sharing between the stocks. 0.1% Broker entry cost and 0.1% exit cost. Only long positions are traded at the closing price on days when we have a buy or sell signal.
This gives the following result for this crossover pair:
With a $25,000 starting capital ($1,000 per stock) using the stocks and rules mentioned before, I get a profit of $36,994 or a +148% profit with an average of 29 trades per stock in the period 01/16/2003 till 11/09/2007.
Kirk Report Interview: Next -Previous -Part 1 -Part 2 -Part 3 -Part 4 -Part 5 -Part 6
-Part 7 -Part 8 -Part 9 -Part 10 -Part 11 -Part 12
STOCATA Stocks Technical Analysis HOME
Links
Find a Stock ticker symbol, enter the ticker and find a chart, news, fundamentals and historical quotes.
Risk Disclosure: Futures and forex trading contains substantial risk and is not for every investor. An investor could potentially lose all or more than the initial investment. Risk capital is money that can be lost without jeopardizing ones’ financial security or life style. Only risk capital should be used for trading and only those with sufficient risk capital should consider trading. Past performance is not necessarily indicative of future results.
Hypothetical Performance Disclosure: Hypothetical performance results have many inherent limitations, some of which are described below. no representation is being made that any account will or is likely to achieve profits or losses similar to those shown; in fact, there are frequently sharp differences between hypothetical performance results and the actual results subsequently achieved by any particular trading program. One of the limitations of hypothetical performance results is that they are generally prepared with the benefit of hindsight. In addition, hypothetical trading does not involve financial risk, and no hypothetical trading record can completely account for the impact of financial risk of actual trading. for example, the ability to withstand losses or to adhere to a particular trading program in spite of trading losses are material points which can also adversely affect actual trading results. There are numerous other factors related to the markets in general or to the implementation of any specific trading program which cannot be fully accounted for in the preparation of hypothetical performance results and all which can adversely affect trading results.
See more 'Legal Disclosures' in the bottom menu bar!