
Latest News
2022 Start working on a new website
BBS Trading Expert
Watch the Youtube BBS video and here is a crude oil trading example
Want to know more about:
AXIOM business books awards, bronze medal! Thank You!
No longer available!
Favorite articles in 2010, 11, 12, 14 and 2015 S&C Readers' Choice Awards.

AXIOM Business Books Awards, bronze medal.

The Kirk Report Interview Part 6
The Kirk Report
Q&A With Sylvain Vervoort
Thursday, December 17, 2009 at 8:16 AM
Kirk Report Interview: Next -Previous -Part 1 -Part 2 -Part 3 -Part 4 -Part 5 -Part 6
-Part 7 -Part 8 -Part 9 -Part 10 -Part 11 -Part 12
Interviewed by Charles E. Kirk from "The Kirk Report"
Kirk: Lots of technical factors are being used, so do fundamental factors like earnings, sales, etc. ever play a role in your approach?
Vervoort: I think the best way of learning to trade purely based on technical analysis is what I used to do: view a number of stocks in an older time period and change the name of the stock viewed. That way you are not influenced by the stock name or any time period, nor by any fundamental factors. If you can trade profitably on that basis, which I have, why should you let the fundamentals influence you in real time with real money on the line?
Kirk: I think you’ve touched on one of the key benefits from a “technical-only” focused approach. By focusing on price action, patterns and indicator analysis versus fundamentals, you rule out a major problem I see in traders and investors. That is, they allow their view of a particular company to bias their analysis. The same can be said about big picture market analysis too!
Much like all successful traders I’ve known, you are focused on finding and exploiting good risk/reward setups. Can you explain what it means for you to find a good risk/reward trade?
Vervoort: The best risk/reward is of course if you can open a trade losing only a few dollars if the price moves against you while at the same time the price is at a point where you expect a medium- to long-term upward move. Basically it means that you are looking for nearby solid support, while resistance is far away or weak. Let me show this kind of setup on the hourly chart of Alcoa (AA):
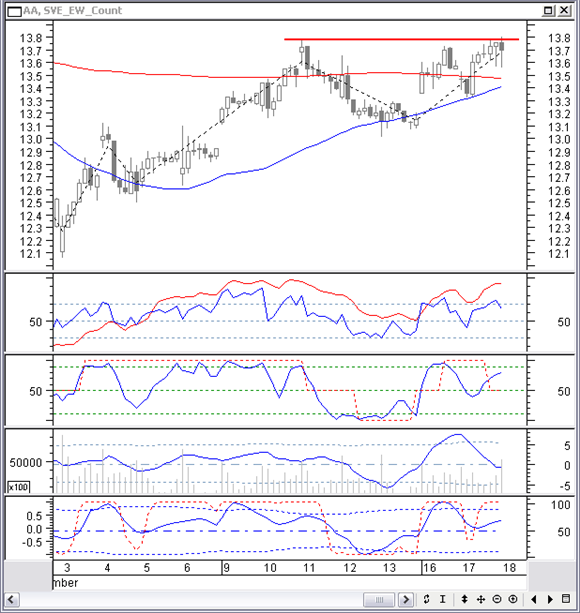
It looks like the price is making a double top. The first top in the candle chart was made with a bearish engulfing pattern. This top is resistance. Now we are reaching this resistance and one hour ago we had a hanging man reversal pattern, confirmed by a black candle with a lower closing price with high volume. This confirms the resistance. In the indicators we can see a short-term divergence building up with room for further downward movement. This is a good point at which to open a short position. You can use a closing price as the initial stop just above the resistance line at $13.8, buying now at $13.7. If the price moves up, it will probably create a loss of no more than 1%, while the profit target for a move down is far more favorable. The only negative point here is that the 50 and 200 hour averages are close, but you can see already the 200-hour average slowly turning down. So, I would without any doubt take this short trade.
Kirk: To put everything together so that we have a better understanding of how you trade, please provide examples of three trades you recently made and the LOCKIT approach you used.
Vervoort: OK, let’s first continue the short trade we started with AA in the last chart by viewing this one:
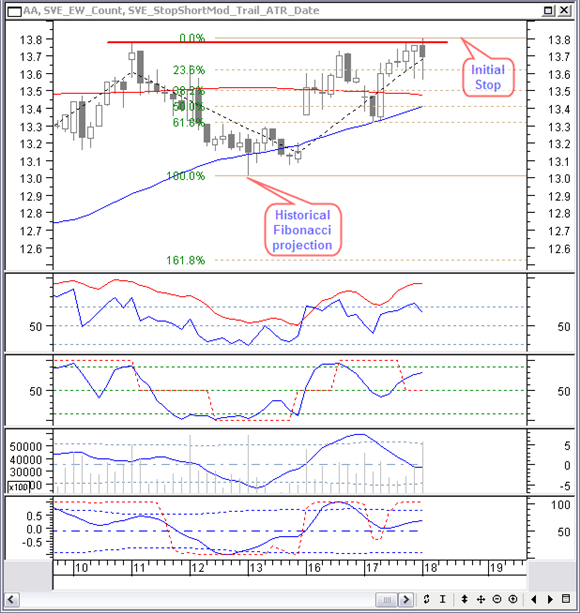
I have the initial closing stop at $13.8. Since price is probably finishing an upward move, I am expecting an Elliot correction wave. In most cases an ABC zigzag pattern. I have no future turning point yet to make a Fibonacci projection, but what I do then is use what I call a historical projection, using a previous turning point. That will most likely show support for future prices and probably be usable as a reference point for my projection. That gives a target price around $12.55.
Let see what came next:
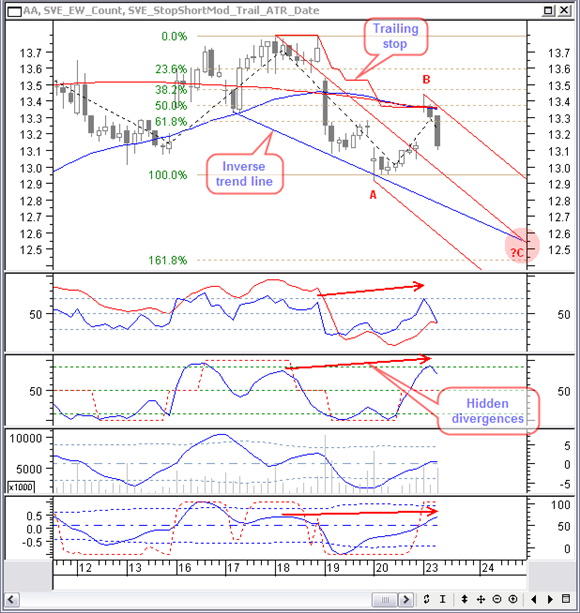
From the opening of the position I also started my modified ATR trailing stop at a multiplying factor of 3. Remember, I am just using the trailing stop as a last warning that the position must be closed. Almost always the position will be closed before the ATR stop, based on various technical analysis techniques. Some three days after opening the short position it looks like price completed the A and B Elliott correction wave and is now on the way for the C wave. The B-wave bounced against the resistance of the 50 and 200-hour simple average.
I can now adapt the ATR trailing stop to a multiplication factor of 2.5, which is the value where it is not broken by the B-wave correction. I move my historical Fibonacci projection to a normal projection between the start and end of wave A. This gives almost the same target value. I can also draw a down moving pitchfork and I expect price to move towards the median line. I can also draw an inverse trend line through the low points. If I am short-term trading on an hourly basis, in that case I will usually set the exit a bit above the target. So, I now set a buy back order at $12.55. In the indicators you can see a hidden divergence. This also confirms a continuation of the previous downtrend.
Kirk Report Interview: Next -Previous -Part 1 -Part 2 -Part 3 -Part 4 -Part 5 -Part 6
-Part 7 -Part 8 -Part 9 -Part 10 -Part 11 -Part 12
STOCATA Stocks Technical Analysis HOME
Links
Find a Stock ticker symbol, enter the ticker and find a chart, news, fundamentals and historical quotes.
Risk Disclosure: Futures and forex trading contains substantial risk and is not for every investor. An investor could potentially lose all or more than the initial investment. Risk capital is money that can be lost without jeopardizing ones’ financial security or life style. Only risk capital should be used for trading and only those with sufficient risk capital should consider trading. Past performance is not necessarily indicative of future results.
Hypothetical Performance Disclosure: Hypothetical performance results have many inherent limitations, some of which are described below. no representation is being made that any account will or is likely to achieve profits or losses similar to those shown; in fact, there are frequently sharp differences between hypothetical performance results and the actual results subsequently achieved by any particular trading program. One of the limitations of hypothetical performance results is that they are generally prepared with the benefit of hindsight. In addition, hypothetical trading does not involve financial risk, and no hypothetical trading record can completely account for the impact of financial risk of actual trading. for example, the ability to withstand losses or to adhere to a particular trading program in spite of trading losses are material points which can also adversely affect actual trading results. There are numerous other factors related to the markets in general or to the implementation of any specific trading program which cannot be fully accounted for in the preparation of hypothetical performance results and all which can adversely affect trading results.
See more 'Legal Disclosures' in the bottom menu bar!