
Latest News
2022 Start working on a new website
BBS Trading Expert
Watch the Youtube BBS video and here is a crude oil trading example
Want to know more about:
AXIOM business books awards, bronze medal! Thank You!
No longer available!
Favorite articles in 2010, 11, 12, 14 and 2015 S&C Readers' Choice Awards.

AXIOM Business Books Awards, bronze medal.

The Kirk Report Interview Part 3
The Kirk Report
Q&A With Sylvain Vervoort
Thursday, December 17, 2009 at 8:16 AM
Kirk Report Interview: Next -Previous -Part 1 -Part 2 -Part 3 -Part 4 -Part 5 -Part 6
-Part 7 -Part 8 -Part 9 -Part 10 -Part 11 -Part 12
Interviewed by Charles E. Kirk from "The Kirk Report"
Kirk: How do you decide which 30 or so stocks are ideal for spotting trading opportunities?
Vervoort: I am looking for stocks that make large price moves over longer periods while avoid stocks that have a history of all of the following:
- Little price change over a longer period
- Very high intraday volatility
- Very high daily volatility
- Regular big surprise moves
In order to do this I visually inspect historical price data. Let me show you an example. First I look at the long term chart as I want to see a steady moving price with large moves like you can see here:
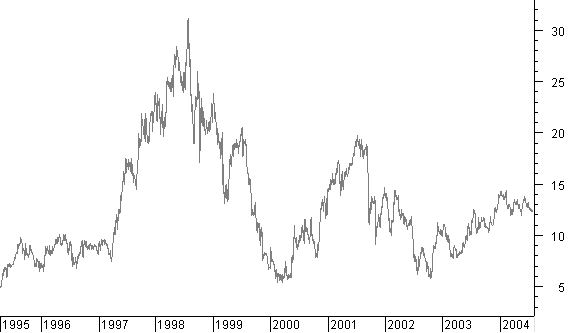
Next I will look with a short-term bar chart. Here I pay attention to intraday and daily volatility and absence of large surprise moves. Let’s view an old chart of United States Steel as an example:
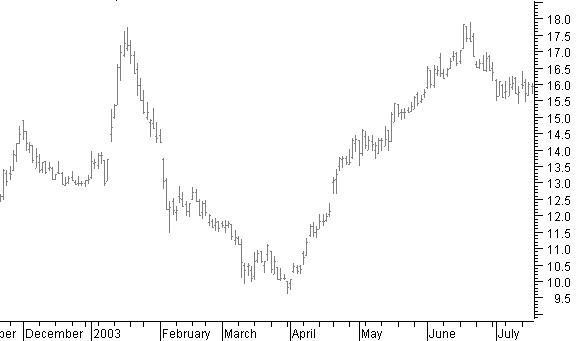
Here you can see that price makes larger short-term moves, without extremes in volatility and without surprises. Gaps or high intraday volatility are in the direction of the short-term trend.
I remove stocks from the list that do not continue the kind of behavior I want and then I look for replacements.
Kirk: Got it. Do you utilize options in your trading strategy?
Vervoort: I used to trade options, simply buying calls or puts. And I do recommend others use options as an insurance instrument for long-term stock investors that want to know the exact risk from the start. For the last few years I have had the impression that options are rather expensive. As a result, they have high implied volatility. Changes in that volatility and time erosion make it difficult to make profits by simply buying calls or puts. It seems that the profit now is higher than ever before for the option writers, but writing options is not my thing. Now I look for buying calls or puts only if I expect a bigger stock price move while my hope is to profit from the leverage. At the same time, however, I have to be prepared to lose the full option investment. That for me means that the money invested in options should not be more than the acceptable loss percentage on the stock.
Kirk: The first thing that you write about in your book on your website is the acronym LOCKIT. Can you provide a rough overview of what LOCKIT stands for?
Vervoort: LOCKIT stand for:
- “Long term” Look first at what the long-term trend is doing and preferably trade only in that direction. If you trade against that direction, be very conscious that you are trading against the trend in a correction phase.
- “Open” Open a trade based on the technical analysis LOCKIT rules. Basically it means that you should look for a buying confirmation given by as many technical analysis tools as possible.
- “Close” Close a trade based on LOCKIT technical analysis rules. Always use an initial stop and use this initial stop and at least a trailing stop at least as the ultimate warning signal that the position must be closed.
- “K-ratio” Keep risk under control by managing capital and using stops. You must apply money management rules and risk management. Do not enter a trade when the possible risk is bigger than the possible profit.
- “Initial stop” Always use an initial stop based on technical analysis and make sure the risk-to-reward ratio is 1 to 3 or better.
- “Trailing stop” Always use a trailing stop to get you out of the trade if other technical analysis closing signals fail (including human failure).
To see how these rules are applied, here is an example of LOCKIT.
Kirk: One thing that is clear by reading the book is that you utilize a multidimensional approach utilizing a number of indicators and charting methods to determine the first three steps of LOCKIT – i.e. determining the trend, finding and exploiting the optimal open for a trade and then figuring out when to close the position. In your book, for example, you talk about how you use rsi, atr, bollinger bands, temas, fibonacci, elliott waves, heikin ashi, moving averages, candlestick charts, pitchforks, and so on. You don’t appear to hang your hat on one specific analysis method, but instead you use layers of different analyses. How did you learn about so many different types of approaches?
Vervoort: There are a number of reasons. First, technical analysis for me is a hobby. And, of course, you want to try out everything available and you are always on the lookout for new methods and combinations that will be successful. Training other people helps a lot. When looking at something new, I am always comparing. Is this new thing better? That is not always an easy task and you have to spend time and effort to find out.
Kirk Report Interview: Next -Previous -Part 1 -Part 2 -Part 3 -Part 4 -Part 5 -Part 6
-Part 7 -Part 8 -Part 9 -Part 10 -Part 11 -Part 12
STOCATA Stocks Technical Analysis HOME
Links
Find a Stock ticker symbol, enter the ticker and find a chart, news, fundamentals and historical quotes.
Risk Disclosure: Futures and forex trading contains substantial risk and is not for every investor. An investor could potentially lose all or more than the initial investment. Risk capital is money that can be lost without jeopardizing ones’ financial security or life style. Only risk capital should be used for trading and only those with sufficient risk capital should consider trading. Past performance is not necessarily indicative of future results.
Hypothetical Performance Disclosure: Hypothetical performance results have many inherent limitations, some of which are described below. no representation is being made that any account will or is likely to achieve profits or losses similar to those shown; in fact, there are frequently sharp differences between hypothetical performance results and the actual results subsequently achieved by any particular trading program. One of the limitations of hypothetical performance results is that they are generally prepared with the benefit of hindsight. In addition, hypothetical trading does not involve financial risk, and no hypothetical trading record can completely account for the impact of financial risk of actual trading. for example, the ability to withstand losses or to adhere to a particular trading program in spite of trading losses are material points which can also adversely affect actual trading results. There are numerous other factors related to the markets in general or to the implementation of any specific trading program which cannot be fully accounted for in the preparation of hypothetical performance results and all which can adversely affect trading results.
See more 'Legal Disclosures' in the bottom menu bar!