
Latest News
2022 Start working on a new website
BBS Trading Expert
Watch the Youtube BBS video and here is a crude oil trading example
Want to know more about:
AXIOM business books awards, bronze medal! Thank You!
No longer available!
Favorite articles in 2010, 11, 12, 14 and 2015 S&C Readers' Choice Awards.

AXIOM Business Books Awards, bronze medal.

Stocks & Commodities Interview
May 2014, Part 3
S&C Interview: Next -Previous -Part 1 -Part 2 -Part 3 -
Interviewed by Jayanthi Gopalakrishnan from "Stocks & Commodities magazine"
CopyRight 2014 Stocks & Commodities magazine.
Tell us about swing trading — what is it and how does it differ from other types of strategies?
A larger up or down move is called a trend, which is composed of a number of up or down swings. The swings will have small pullbacks, which will mostly retrace no more than 50% of the previous swing in the trend. I would say that 80% of the time, the next swing in the direction of the ongoing trend is started after the swing pullback. Let’s look at a daily chart of the S&P 500 index (Figure 5). In the second half of November there was a start of a longerterm uptrend move. In an uptrend, there are higher bottoms and higher tops. The start of the uptrend is confirmed with the first higher bottom in January 2013, with price finding support on a smaller, previous pullback. From that point, the next swing up is started. A good entry point to capture the next swing up is when the previous top of December 2012 is broken. The index moves up until the second half of February, when the next pullback correction is started. This correction brings price down to the level of the active support of the 50-day green simple moving average (SMA). Again, you can use the break of the previous top to enter the next upswing. Notice from the chart in Figure 5 that several times, price bounces off the previous resistance line of the February top. With this support and the support of the 50-day SMA, a last upswing begins. Stops to be used with swing trading on a daily chart can be in the order of 5% to 15% depending of the volatility of the underlying instrument.
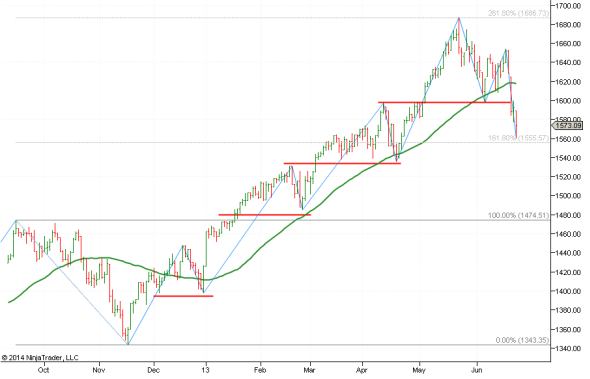
Figure 5: Daily chart S&P 500.
What are the benefits of swing trading?
Basically, you trade swings in the direction of the larger trend. This increases your chance of making a profit. Swing trading, even on a daily chart, requires stop-loss settings of around 10%. But compare this stop to a buy & hold strategy, where you would use stops of around 25%. I would think that for most people, the swing trading stop of 10% would be more acceptable. It would be difficult to take a 25% loss, since you may end up with a very large loss from which you may never recover.
It’s almost impossible to always enter and exit at tops and bottoms of swings. What indicators or patterns do you use to identify entry and exit points of the swings?
I think most traders have learned that there is no such thing as always in trading. But using appropriate technical analysis techniques, we can take advantage of these techniques, making profits at the end of the day. Let’s look again at Figure 5. From the beginning of the uptrend, you could have drawn a historical Fibonacci projection using the historical top of September. This gives targets at 161.8% and 261.8%. At the 161.8% projection, you can see a longer-term consolidation phase. When price reached the 261.8% projection, you do not know if this is the end of the uptrend, but given the size of the up move and that it reached a Fibonacci price target, that is enough to consider taking a profit. Next, you would wait to see how far the reaction goes. The first leg of the reaction finds support on the resistance of a previous top. What you can see now is that the pullback reaction is larger than the previous ones, and the next move up does not break above the last top, that is, the uptrend didn’t continue. When the previous bottom is broken, you can assume that the uptrend changed to a downtrend. Swing trading in the direction of the trend with clear entry points is good practice for making consistent profits. I use just one indicator, a stochastic RSI, to find overbought and oversold price level confirmation. A trend reversal will almost always show a positive or negative divergence between price and this indicator. And, oftentimes, a continuation of the trend will be confirmed with a hidden divergence.
Once you enter a trade, what techniques do you apply to manage your positions? Why is it important to manage positions once you are in a trade?
I use a number of different tools to handle open trades. The fi rst action is automatically executed after opening the trade. A larger emergency stop order and a larger profi t target order will be set automatically. This stop and target is set at the broker’s level and is visible to the market. What is important is that these orders will be executed even if I lose control as a result of a broken PC or Internet connection, or so on. I use a smaller stop based on technical analysis levels and a target limit that will be executed only when this smaller technical stop or target is reached. The nice thing is that these levels are not visible in the market. It is purely under the control of the strategy that is running on my PC. I also have the possibility to set a manual stop and target price, which I can adapt at any moment. The next level is an automated trading expert that will close the trade automatically when the expert sell signal appears. Or it may open a new opposite trade automatically if a new buy signal appears. It is, of course, possible to manually open or close any trade without interrupting the running strategy. And the strategy will change the original stop level at the broker’s level once a breakeven price change is reached. Finally, I can draw support, resistance, or trendlines. A crossing of these lines will create either a buy or sell signal. They can be set up either as stop or limit price levels. That way, I can automatically close or open a trade based on the breaking of a trendline or, for example, reaching a Fibonacci price target or retracement level. All settings are compatible, and the one generating the fi rst signal wins. With all these possibilities programmed, you can understand that it is important to manage open positions and have all tools at your fi ngertips to act fast and from different angles.

My first homemade computer.
How do you handle emotions when they arise while you are trading?
I assume most people, including myself, have minimal problems dealing with emotions when opening a trade. Either I use clear entry rules or a trade is opened in full auto mode. Closing trades is a different story. What do I do if I start having any doubts about holding a trade or closing it? I look at support levels and the possible loss involved. With the help of the tools for handling open trades, which I mentioned previously, I will set stops and targets with the help of these tools or act manually immediately if I think further waiting makes no sense. From that point, I will no longer look at the screen or at least look at it without emotion. What also helps is taking profi ts. Once there is a level of profi t, I will try to take profi t at the level of some smaller resistance level and reenter the trade at a small reaction, one that is suffi cient to recover the cost of closing and opening a new trade. I do this because it always feels bad to see a profi t turn into a loss, with bad emotions as a result.
Thank you for sharing your thoughts with us, Sylvain.
S&C Interview: Next -Previous -Part 1 -Part 2 -Part 3 -
STOCATA Stocks Technical Analysis HOME
Links
Find a Stock ticker symbol, enter the ticker and find a chart, news, fundamentals and historical quotes.
Risk Disclosure: Futures and forex trading contains substantial risk and is not for every investor. An investor could potentially lose all or more than the initial investment. Risk capital is money that can be lost without jeopardizing ones’ financial security or life style. Only risk capital should be used for trading and only those with sufficient risk capital should consider trading. Past performance is not necessarily indicative of future results.
Hypothetical Performance Disclosure: Hypothetical performance results have many inherent limitations, some of which are described below. no representation is being made that any account will or is likely to achieve profits or losses similar to those shown; in fact, there are frequently sharp differences between hypothetical performance results and the actual results subsequently achieved by any particular trading program. One of the limitations of hypothetical performance results is that they are generally prepared with the benefit of hindsight. In addition, hypothetical trading does not involve financial risk, and no hypothetical trading record can completely account for the impact of financial risk of actual trading. for example, the ability to withstand losses or to adhere to a particular trading program in spite of trading losses are material points which can also adversely affect actual trading results. There are numerous other factors related to the markets in general or to the implementation of any specific trading program which cannot be fully accounted for in the preparation of hypothetical performance results and all which can adversely affect trading results.
See more 'Legal Disclosures' in the bottom menu bar!