
Latest News
2022 Start working on a new website
BBS Trading Expert
Watch the Youtube BBS video and here is a crude oil trading example
Want to know more about:
AXIOM business books awards, bronze medal! Thank You!
No longer available!
Favorite articles in 2010, 11, 12, 14 and 2015 S&C Readers' Choice Awards.

AXIOM Business Books Awards, bronze medal.

LOCKIT Stock Trading -
Step2: Opening a position
After looking at the long term in LOCKIT step 1, let’s investigate the medium term using a weekly chart with the idea that you are looking for the bigger medium term trades. Are you on the contrary a short term trader you would only look at the weekly chart to find out if price is not coming to a medium term reversal point. We will use all technical analysis techniques as explained in the basic theoretical part.
CA Inc weekly chart
08/13/2004 Let’s look at figure 1.4, the weekly chart of CA Inc.
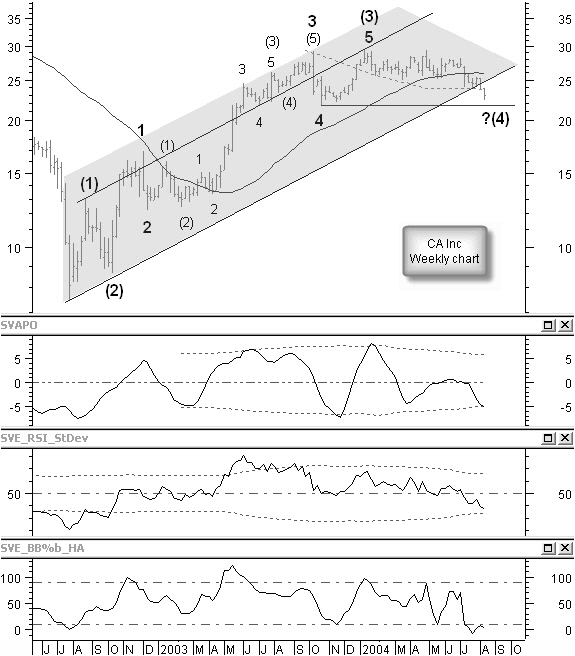
Figure 1.4: investigating the medium term trend on the weekly chart of CA Inc
Because of the big price shift in this longer period, we use a semi-logarithmic scale for this weekly chart. First we look for a probable Elliott wave count. If our count is correct we may be near the end of a longer term correction wave (4). Correction wave (2) was a sharp correction and most of the time wave four will then follow with a flat correction, this seems the case here. Drawing a trend line through the tops (1) and (3) and a parallel line through bottom (2) show that we have reached a target price for wave (4) at the bottom of this channel. At the same time we reach support at the 200 days simple moving average (dashed line) and we are finding support at a previous low point (wave 4 bottom) at a price level of $22.0.
We are using three indicators:
SVAPO with the standard settings, the standard 14 (weeks) SVE_RSI_StDev and the standard 18 (weeks) SVE_BB%b_HA. Important to look at, is if these indicators are making convergent or divergent moves.
These indicators are now moving in the lower part of their normal space. So we can see that there is room for an up move, needed to create the next impulse wave (5), which must bring price above the top of wave (3) or above $29.6.
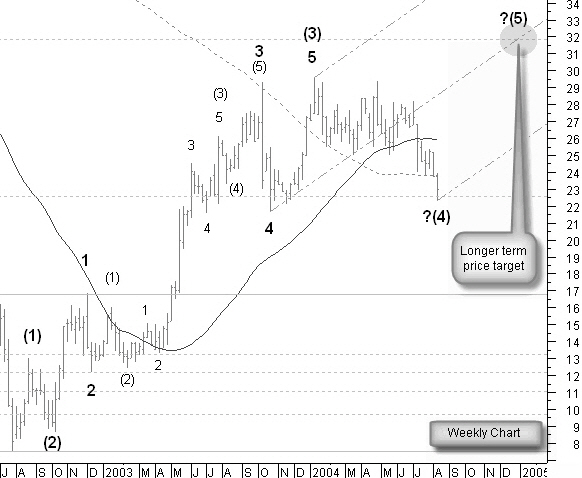
Figure 1.5: Projecting the long term price target on the weekly chart of CA Inc
Looking at figure 1.5 and assuming that we reached a not yet confirmed bottom of wave (4), we could try to make a future price projection for wave (5). A Fibonacci projection with a first target at $22.5 has already given support three times for different wave 4 corrections. A rising pitchfork, in line with the rising prices and the average, is crossing the second Fibonacci target at $32.0. This is the closest target for the medium term to be reached in about 20 weeks.
Special offer: "Capturing Profit with technical Analysis"
Careful! This projection is only valid if we really have reached the turning point starting impulse wave (5) now. Considering the solid support here, there is a good chance we are at the turning point.
LOCKIT Stock Trading Application Next -Previous -Part 1 -Part 2 -Part 3 -Part 4 -Part 5
STOCATA Stocks Technical Analysis HOME
Links
Find a Stock ticker symbol, enter the ticker and find a chart, news, fundamentals and historical quotes.
Risk Disclosure: Futures and forex trading contains substantial risk and is not for every investor. An investor could potentially lose all or more than the initial investment. Risk capital is money that can be lost without jeopardizing ones’ financial security or life style. Only risk capital should be used for trading and only those with sufficient risk capital should consider trading. Past performance is not necessarily indicative of future results.
Hypothetical Performance Disclosure: Hypothetical performance results have many inherent limitations, some of which are described below. no representation is being made that any account will or is likely to achieve profits or losses similar to those shown; in fact, there are frequently sharp differences between hypothetical performance results and the actual results subsequently achieved by any particular trading program. One of the limitations of hypothetical performance results is that they are generally prepared with the benefit of hindsight. In addition, hypothetical trading does not involve financial risk, and no hypothetical trading record can completely account for the impact of financial risk of actual trading. for example, the ability to withstand losses or to adhere to a particular trading program in spite of trading losses are material points which can also adversely affect actual trading results. There are numerous other factors related to the markets in general or to the implementation of any specific trading program which cannot be fully accounted for in the preparation of hypothetical performance results and all which can adversely affect trading results.
See more 'Legal Disclosures' in the bottom menu bar!