
Latest News
2022 Start working on a new website
BBS Trading Expert
Watch the Youtube BBS video and here is a crude oil trading example
Want to know more about:
AXIOM business books awards, bronze medal! Thank You!
No longer available!
Favorite articles in 2010, 11, 12, 14 and 2015 S&C Readers' Choice Awards.

AXIOM Business Books Awards, bronze medal.

LOCKIT Stock Trading Part 3
CA Inc daily chart
Finally, let’s look at the daily candlesticks chart over the last few months.
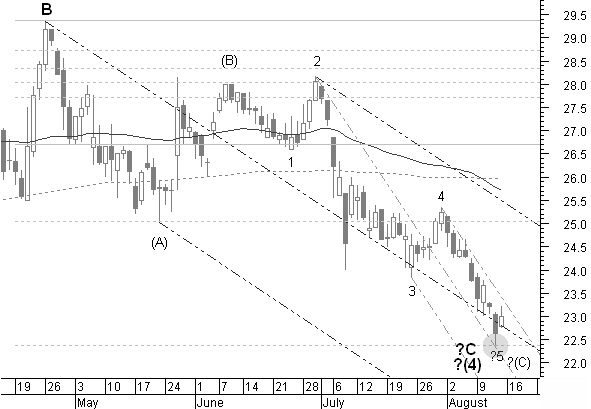
Figure 1.6: Analyzing the daily candlestick chart of CA Inc.
In figure 1.6, correction wave (4) consists out of an ABC correction. The C correction itself has a lower order wave with another (A)(B)(C) correction of which the (C) correction finally looks like an impulse wave.
We can see a number of signs indicating a possible end of this correction.
Price is reaching a second Fibonacci target at $22.4, drawn from the top of the B wave and the first correction in the down move. Also the first Fibonacci target at $25.0 was exactly touched by intermediate wave (A).
A falling pitchfork between B, (A) and 2 gives a medium term down moving channel. Price reaches again the median line of this pitchfork in the neighborhood of the second Fibonacci projection target.
Price now also touches the median line of a short term down moving pitchfork drawn between the wave points 2, 3 and 4 and this exactly on the second Fibonacci target.
Price is moving far away from its 50 and 200 days simple moving average. A move towards these averages is expected.
Special offer: "Capturing Profit with technical Analysis"
The last two candles make up a bullish harami pattern, a candlestick bottom reversal pattern.
Let’s also have a look at the indicators on the daily chart of figure 1.7.
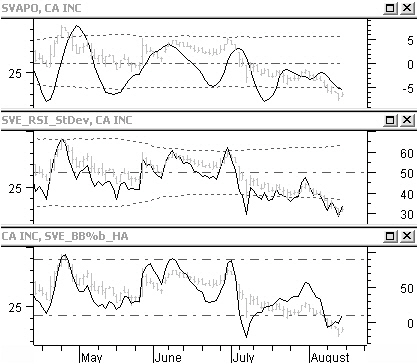
Figure 1.7: Interpreting the indicators on the daily chart of CA Inc.
If this is going to be the turning point, we will see next a divergence in the SVAPO indicator.
The RSI indicator is below the lower standard deviation line in oversold territory.
And the BB%b indicator has already a divergence with price and is moving up from below the 10-reference line.
Clearly, a turning point can not be far away!
This is the second step in LOckit: Make use of the complete arsenal of technical analysis tools to decide if opening a position now is the right thing to do.
LOCKIT Stock Trading Application Next -Previous -Part 1 -Part 2 -Part 3 -Part 4 -Part 5
Links
Find a Stock ticker symbol, enter the ticker and find a chart, news, fundamentals and historical quotes.
Risk Disclosure: Futures and forex trading contains substantial risk and is not for every investor. An investor could potentially lose all or more than the initial investment. Risk capital is money that can be lost without jeopardizing ones’ financial security or life style. Only risk capital should be used for trading and only those with sufficient risk capital should consider trading. Past performance is not necessarily indicative of future results.
Hypothetical Performance Disclosure: Hypothetical performance results have many inherent limitations, some of which are described below. no representation is being made that any account will or is likely to achieve profits or losses similar to those shown; in fact, there are frequently sharp differences between hypothetical performance results and the actual results subsequently achieved by any particular trading program. One of the limitations of hypothetical performance results is that they are generally prepared with the benefit of hindsight. In addition, hypothetical trading does not involve financial risk, and no hypothetical trading record can completely account for the impact of financial risk of actual trading. for example, the ability to withstand losses or to adhere to a particular trading program in spite of trading losses are material points which can also adversely affect actual trading results. There are numerous other factors related to the markets in general or to the implementation of any specific trading program which cannot be fully accounted for in the preparation of hypothetical performance results and all which can adversely affect trading results.
See more 'Legal Disclosures' in the bottom menu bar!