
Latest News
2022 Start working on a new website
BBS Trading Expert
Watch the Youtube BBS video and here is a crude oil trading example
Want to know more about:
AXIOM business books awards, bronze medal! Thank You!
No longer available!
Favorite articles in 2010, 11, 12, 14 and 2015 S&C Readers' Choice Awards.

AXIOM Business Books Awards, bronze medal.

LOCKIT Stock Trading Part 5
Step 3: Closing the trade
Long position CA Inc short term follow-up
Looking for short term trading with CA Inc, you can see in figure 1.13 we are using a 5% trailing stop that seems to follow best the short term price moves.
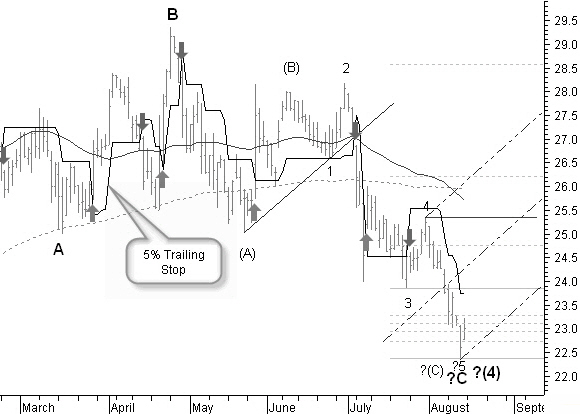
Figure 1.13: Buying point and short term follow-up of CA Inc with a 5% trailing stop.
We bought CA Inc on 08/13/2004 for $23.0. The initial stop is set at $22.35. We keep a short term trailing stop at 5%.
Important short term price targets are at $25.4, a previous top and resistance from the 50 and 200 days simple moving average. The next target is at $28.5, the third Fibonacci projection in the neighborhood of a total of four previous tops with wave tops (B) and 2.
10/06/2004 Sell now?
After opening the position price moves straight up to the first Fibonacci target at $24.75.
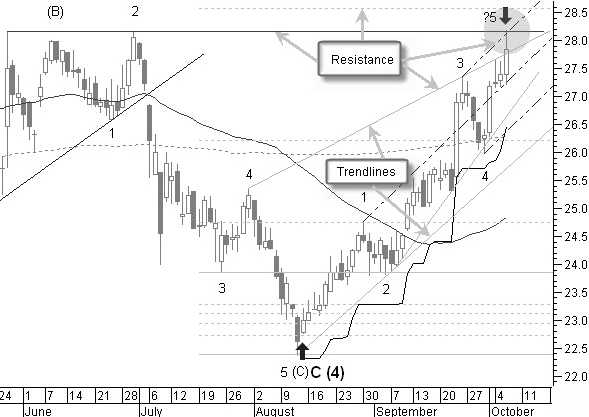
Figure 1.14: A lot of resistance in the daily chart, time to close CA Inc.
In figure 1.14 we see end of August a short term correction. If we do a Fibonacci projection from this new pivot point, we get exactly the same targets as before, proving that historical Fibonacci projections do work.
Special offer: "Capturing Profit with technical Analysis"
After this short term correction, price continues its move up to the second Fibonacci target. During this way up, the 50 and 200 days moving averages are broken. The original uptrend line from the start of wave 1 and the bottom of wave 2 can from now on be drawn more sharply.
Next there is a short correction back to the Fibonacci level now giving support and the sharper uptrend line, there was enough support here to turn price back up again.
October 6 2004, price reaches a new high value at a level where a lot of resistance can be found.
- We are exactly at the resistance of the line through (B) and 2.
- We are close to the third Fibonacci price target.
- We reach the upper side of a short term sharp up moving pitchfork.
- We reach the resistance of an inverse trend line.
- And we basically completed an Elliott impulse wave count. Most probably we are looking at the end of wave 5.
If on the way up there were good arguments to close our position, this seems to be the right moment. During the way up, there was no problem with the initial stop or the trailing stop.
We will always try to close the position based on good technical arguments and not wait for the trailing stop to be broken. If however the trailing stop is broken while we have not yet closed the position, than the position MUST be closed!
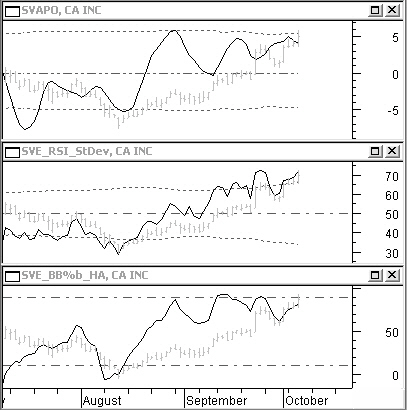
Figure 1.15: CA Inc diverging indicators give a selling agreement.
Of course before closing, we also have a look at our indicators in figure 1.15.
We can see a divergence with a second lower top in SVAPO, the RSI indicator is topping and probably in the making of a divergence and there is divergence with lower tops in SVE_BB%b_HA.
Conclusion: the indicators are in agreement of a top being reached.
We sell our 54 shares of CA Inc at a closing price of $27.85 for a total amount of $1,503.9, minus the buying cost of $1,242, leaves a profit of $261.9 or 21%.
The new available capital for buying this stock the next time is: $1,250+$261.9=$1,511.9.
October 18, 2004 Opening a new long position
Read the rest of the trading in the "Capturing Profit with Technical Analysis" book....
The final result here was a profit of $495 on the starting capital of $1250 in less than 4 months time.
Using the LOCKIT system for trading based on a good knowledge of the basic technical analysis techniques gives you a good chance for making more profit in the stock market.
LOCKIT Rules for opening and closing positions
An overview of the LOCKIT rules for opening and closing a long or short position.
Rules for opening a long position with a trend reversal
A trend reversal will be more certain when more rules are giving a signal. In the example charts we will use the reference letters of the rules to indicate which rules are complied with.
See the "Capturing Profit with Technical Analysis" book
Rules for closing a long position after a trend reversal
See the "Capturing Profit with Technical Analysis" book
Rules for opening a short position after a trend reversal
See the "Capturing Profit with Technical Analysis" book
Rules for closing a short position after a trend reversal
See the "Capturing Profit with Technical Analysis" book
Rules for opening a long position after a price correction
See the "Capturing Profit with Technical Analysis" book
Rules for closing a long position after a price correction
See the "Capturing Profit with Technical Analysis" book
Rules for opening a short position after a price correction
See the "Capturing Profit with Technical Analysis" book
Rules for closing a short position after a price correction
See the "Capturing Profit with Technical Analysis" book
LOCKIT Stock Trading Application Previous -Part 1 -Part 2 -Part 3 -Part 4 -Part 5
STOCATA Stocks Technical Analysis HOME
Links
Find a Stock ticker symbol, enter the ticker and find a chart, news, fundamentals and historical quotes.
Risk Disclosure: Futures and forex trading contains substantial risk and is not for every investor. An investor could potentially lose all or more than the initial investment. Risk capital is money that can be lost without jeopardizing ones’ financial security or life style. Only risk capital should be used for trading and only those with sufficient risk capital should consider trading. Past performance is not necessarily indicative of future results.
Hypothetical Performance Disclosure: Hypothetical performance results have many inherent limitations, some of which are described below. no representation is being made that any account will or is likely to achieve profits or losses similar to those shown; in fact, there are frequently sharp differences between hypothetical performance results and the actual results subsequently achieved by any particular trading program. One of the limitations of hypothetical performance results is that they are generally prepared with the benefit of hindsight. In addition, hypothetical trading does not involve financial risk, and no hypothetical trading record can completely account for the impact of financial risk of actual trading. for example, the ability to withstand losses or to adhere to a particular trading program in spite of trading losses are material points which can also adversely affect actual trading results. There are numerous other factors related to the markets in general or to the implementation of any specific trading program which cannot be fully accounted for in the preparation of hypothetical performance results and all which can adversely affect trading results.
See more 'Legal Disclosures' in the bottom menu bar!