
Latest News
2022 Start working on a new website
BBS Trading Expert
Watch the Youtube BBS video and here is a crude oil trading example
Want to know more about:
AXIOM business books awards, bronze medal! Thank You!
No longer available!
Favorite articles in 2010, 11, 12, 14 and 2015 S&C Readers' Choice Awards.

AXIOM Business Books Awards, bronze medal.

LOCKIT Stock Trading Part 4
Step 4: Money and Risk management
Step 3 closing a position, will be discussed after steps 4-5-6.
Money management
To comply with good money management, we will invest in a fixed number of stocks. Each stock will get a starting capital equal to the total capital divided by the fixed number of stocks. There is no profit or loss sharing between the stocks. We consider this the most effective system with the best result in the long run.
With a starting capital of $25,000 and a selection of 20 stocks, each stock will get $1,250 from the start. Losing 10% in one stock and one trade will be limited to $125 or just 1% of the total portfolio value. Furthermore, the total loss of one stock can never be more than $1,250 or 5% of the total portfolio value. This kind of money management makes the trading system very crash resistant.
The detailed study of this kind of money management can be found in the theoretical part of the book.
Special offer: "Capturing Profit with technical Analysis"
Risk Management
Risk management means looking for an initial stop and a price target that gives you a good risk/reward ratio. The initial risk should be as low as possible but must have solid technical grounds.
Since we have a reversal candlestick pattern, we will take the low side of this pattern as the initial stop level. A closing price below this level is a selling signal. In our case this means buying at $23.0 with a stop at $22.35 or a very low risk of only 3%.
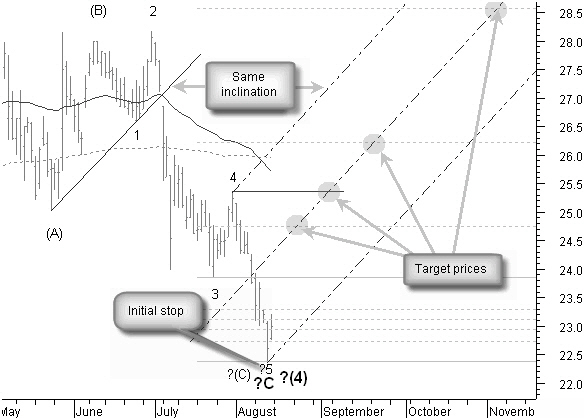
Figure 1.8: Price targets and risk/reward ratio on the daily chart of CA Inc.
In figure 1.8 you can see how for the moment we can only create a Fibonacci price target using a historical Fibonacci projection. From the actual low point to the previous low point, the bottom of wave 3, giving us 3 possible targets.
An important target is the first price resistance at the top of wave 4 at $25.35. At this level we can also expect resistance from the 50 and 200 days moving average. Our initial stop and this target give us a good risk/reward ratio and justifies opening a long position now.
To have an idea when this target could be reached, we need crossing this target with some other line. There is however nothing usable available for the moment. What we could try is creating a fictive pitchfork. To find an acceptable inclination for this pitchfork, we can use the previous uptrend line between (A) and 1 as a reference.
Buying now, we comply with good money and risk management. On 08/13/2004 we buy: $1250/$23 = 54 shares of CA Inc. The possible loss is $0.65 per share and the first price target is $2.35 higher. This gives us a good risk/reward ratio in our favor of 3.6.
Step 5: Initial stop
Right from the start we always set an initial stop.
Possibly the most important and most difficult decision will be closing the position when the initial stop gets broken by the closing price. Here it means the closing price should not fall below $22.35. Taking the decision to sell on breaking the initial stop is independent if dealing with long or short term Investing. There must be no doubt, no discussion, no “yes but” or any other excuse. If the closing price breaks your initial stop, you MUST sell!
Step 6: Trailing stop
Equally important, but rather in relation with holding on to as much profit as possible, is closing the position when price falls through the trailing stop. Probably technical analysis gave you already selling signals before, but if you misinterpreted them, the trailing stop should take care of closing the position before losing all of the profit. So, if price falls through the trailing stop, you MUST close the position. The trailing stop used is not only dependant of the investment period, short, medium or long term, but also related to the volatility of the stock.
To get an idea of the stop percentage to apply for a certain stock in a certain period, you can use the following trailing stop MetaStock® formula:
{SVE_Stop_trail}
This formula and which trailing stop to use can be found in the book.
LOCKIT Stock Trading Application Next -Previous -Part 1 -Part 2 -Part 3 -Part 4 -Part 5
STOCATA Stocks Technical Analysis HOME
Links
Find a Stock ticker symbol, enter the ticker and find a chart, news, fundamentals and historical quotes.
Risk Disclosure: Futures and forex trading contains substantial risk and is not for every investor. An investor could potentially lose all or more than the initial investment. Risk capital is money that can be lost without jeopardizing ones’ financial security or life style. Only risk capital should be used for trading and only those with sufficient risk capital should consider trading. Past performance is not necessarily indicative of future results.
Hypothetical Performance Disclosure: Hypothetical performance results have many inherent limitations, some of which are described below. no representation is being made that any account will or is likely to achieve profits or losses similar to those shown; in fact, there are frequently sharp differences between hypothetical performance results and the actual results subsequently achieved by any particular trading program. One of the limitations of hypothetical performance results is that they are generally prepared with the benefit of hindsight. In addition, hypothetical trading does not involve financial risk, and no hypothetical trading record can completely account for the impact of financial risk of actual trading. for example, the ability to withstand losses or to adhere to a particular trading program in spite of trading losses are material points which can also adversely affect actual trading results. There are numerous other factors related to the markets in general or to the implementation of any specific trading program which cannot be fully accounted for in the preparation of hypothetical performance results and all which can adversely affect trading results.
See more 'Legal Disclosures' in the bottom menu bar!