
Latest News
2022 Start working on a new website
BBS Trading Expert
Watch the Youtube BBS video and here is a crude oil trading example
Want to know more about:
AXIOM business books awards, bronze medal! Thank You!
No longer available!
Favorite articles in 2010, 11, 12, 14 and 2015 S&C Readers' Choice Awards.

AXIOM Business Books Awards, bronze medal.

Stocks Technical Analysis Basics Part 2
Linear or Logarithmic Scaling
Linear Scaling
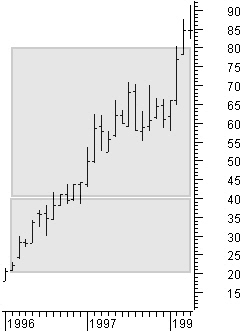 If you are using a division of five points on a linear scale, a price change from $20 to $40 comprises four divisions, whereas a price change from $40 to $80 comprises eight divisions.
This means that the distance on the vertical axis in figure 4.4 from $40 to $80 is twice as large as the one from $20 to $40. On the other hand, a price change from $20 to $40 or from $40 to $80 equals the same 100% price increase.
A price moving from $5 to $10 or from $100 to $105 is the same distance on a linear scale.
Clearly, this does not provide a good visual impression of what the price movement really represents.
Moving from $5 to $10 equals a 100% price increase, but moving from $100 to $105 equals only a 5% increase.
Figure 4.4: Linear scaling.
Semi-logarithmic Scaling
To have the same distance on the vertical scale representing equal percent changes, you can use logarithmic scaling.
Special offer: "Capturing Profit with technical Analysis"
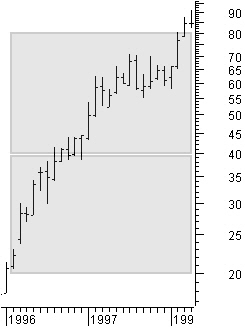
We use the expression “semi-logarithmic scaling” because there is a linear time scale on the horizontal axis and a logarithmic price scale on the vertical axis (figure 4.5).
This means that the distance on the vertical axis from $40 to $80 is now the same as the one from $20 to $40, namely a 100% price increase.
This gives a much better visual impression on charts with large price moves.
For a chart with small overall price changes up to 50% or more, the difference between a linear and a logarithmic scale will be hardly visible on the screen.
Figure 4.5: Semi logarithmic scaling.
Using Linear or Logarithmic Scaling on the Price Axis
When there are large price moves, applying a linear scale can be a disadvantage.
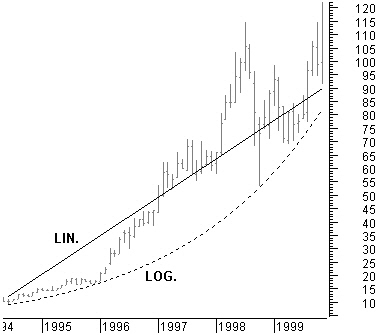
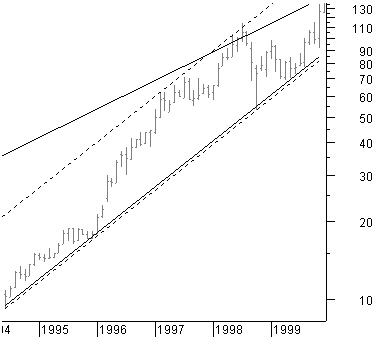
As you can see in figure 4.6, it is simply not possible to draw a trendline under the up-move from 1996 through 2000.
When you use a logarithmic trendline (the dotted line), the price finds support on this trendline.
Compare this to the linear line that is drawn between the same start and endpoint as the logarithmic curve.
Figure 4.6: Linear and logarithmic trendline on linear price scale.
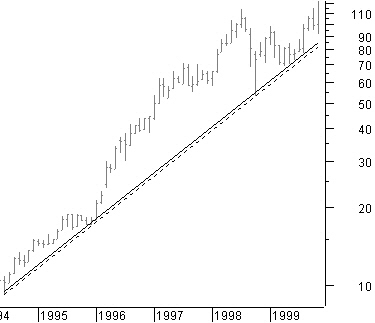
Figure 4.7: Linear and logarithmic trendline on logarithmic price scale.
In figure 4.7, you see the same chart, but this time it’s using a logarithmic scale on the vertical axis. It is no longer a problem to have a linear trendline under the monthly price move from 1996 through 2000. The dotted logarithmic curve is now a straight line because the logarithmic scale on the vertical axis compensates the logarithmic curve of this trendline.
The correct choice is to use a logarithmic scale on the charts. This gives you the ability to use linear trendlines without a problem.
There is, however, a serious disadvantage. In the chart in figure 4.8, both the linear and logarithmic trendlines were moved up to see if they can form a trend channel. This works well with the logarithmic trendline because it is compensated at every level by the logarithmic vertical axis scaling.
But this is not the case for the linear trendline. Moving the linear trendline will change the inclination of that line because it is moving into a different price range.
So the correct thing to do is to use a logarithmic trendline on a logarithmic price chart.
Figure 4.8: Moving a linear trendline on a logarithmic price scale.
Nevertheless, most people will use linear scaling on daily price charts, which is fine as long as the price moves within limits. More often, logarithmic scaling is applied to longer-term charts, such as weekly or monthly charts, mainly because the price moves are much more significant. The right solution is to use logarithmic price charts with logarithmic trendlines all the time.
In general LOCKIT uses linear scaling on daily charts and semi-logarithmic scaling on weekly and monthly charts.
Technical Analysis basics Next -Previous -Part 1 -Part 2 -Part 3 -Part 4 -Part 5
STOCATA Stocks Technical Analysis HOME
Links
Find a Stock ticker symbol, enter the ticker and find a chart, news, fundamentals and historical quotes.
Risk Disclosure: Futures and forex trading contains substantial risk and is not for every investor. An investor could potentially lose all or more than the initial investment. Risk capital is money that can be lost without jeopardizing ones’ financial security or life style. Only risk capital should be used for trading and only those with sufficient risk capital should consider trading. Past performance is not necessarily indicative of future results.
Hypothetical Performance Disclosure: Hypothetical performance results have many inherent limitations, some of which are described below. no representation is being made that any account will or is likely to achieve profits or losses similar to those shown; in fact, there are frequently sharp differences between hypothetical performance results and the actual results subsequently achieved by any particular trading program. One of the limitations of hypothetical performance results is that they are generally prepared with the benefit of hindsight. In addition, hypothetical trading does not involve financial risk, and no hypothetical trading record can completely account for the impact of financial risk of actual trading. for example, the ability to withstand losses or to adhere to a particular trading program in spite of trading losses are material points which can also adversely affect actual trading results. There are numerous other factors related to the markets in general or to the implementation of any specific trading program which cannot be fully accounted for in the preparation of hypothetical performance results and all which can adversely affect trading results.
See more 'Legal Disclosures' in the bottom menu bar!