
Latest News
2022 Start working on a new website
BBS Trading Expert
Watch the Youtube BBS video and here is a crude oil trading example
Want to know more about:
AXIOM business books awards, bronze medal! Thank You!
No longer available!
Favorite articles in 2010, 11, 12, 14 and 2015 S&C Readers' Choice Awards.

AXIOM Business Books Awards, bronze medal.

Stocks Technical Analysis Basics Part 3
Volume
Volume bars are represented mostly as a histogram in a separate window below the price bars. Rising volume with rising or falling prices points to a rising (stock accumulation) or a falling (stock distribution) stock trend, respectively. Falling volume, on the other hand, points in the direction of a price correction.
Special offer: "Capturing Profit with technical Analysis"
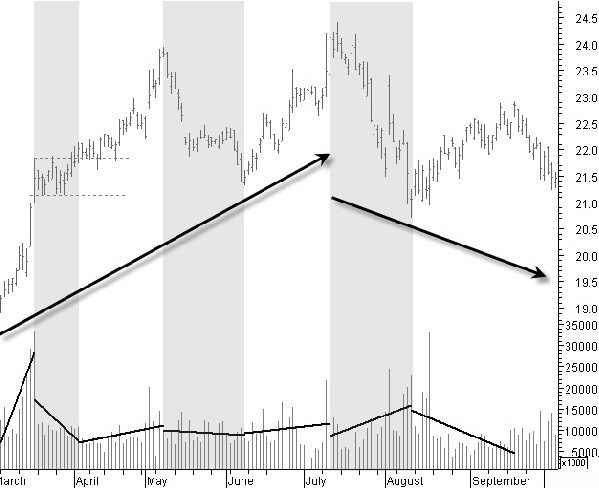
Figure 4.9: Rising and falling volume.
In the Unilever chart (figure 4.9), we see a rising price level beginning in March with rising volume. This is followed by a price consolidation, confirmed by falling volume. Volume up or downtrend is indicated by linear regression lines over the volume bars.
The price continues its way up, and a new top is reached with up-volume. Falling prices and falling volume in May indicate a correction, an additional price up-move is expected after this correction. The new up-move starts beginning in June and moves up until the beginning of July, with increased volume.
The next move down is not simply a correction, but the start of a new downward move. Prices are now falling with increased volume. The move up in August is a price correction because it has decreasing volume. As a whole, you can now see an up-going trend with corrections from March until the beginning of July, followed by a down-going trend.
Technical Analysis basics NEXT -Previous -Part 1 -Part 2 -Part 3 -Part 4 -Part 5
STOCATA Stocks Technical Analysis HOME
Links
Find a Stock ticker symbol, enter the ticker and find a chart, news, fundamentals and historical quotes.
Risk Disclosure: Futures and forex trading contains substantial risk and is not for every investor. An investor could potentially lose all or more than the initial investment. Risk capital is money that can be lost without jeopardizing ones’ financial security or life style. Only risk capital should be used for trading and only those with sufficient risk capital should consider trading. Past performance is not necessarily indicative of future results.
Hypothetical Performance Disclosure: Hypothetical performance results have many inherent limitations, some of which are described below. no representation is being made that any account will or is likely to achieve profits or losses similar to those shown; in fact, there are frequently sharp differences between hypothetical performance results and the actual results subsequently achieved by any particular trading program. One of the limitations of hypothetical performance results is that they are generally prepared with the benefit of hindsight. In addition, hypothetical trading does not involve financial risk, and no hypothetical trading record can completely account for the impact of financial risk of actual trading. for example, the ability to withstand losses or to adhere to a particular trading program in spite of trading losses are material points which can also adversely affect actual trading results. There are numerous other factors related to the markets in general or to the implementation of any specific trading program which cannot be fully accounted for in the preparation of hypothetical performance results and all which can adversely affect trading results.
See more 'Legal Disclosures' in the bottom menu bar!