
Latest News
2022 Start working on a new website
BBS Trading Expert
Watch the Youtube BBS video and here is a crude oil trading example
Want to know more about:
AXIOM business books awards, bronze medal! Thank You!
No longer available!
Favorite articles in 2010, 11, 12, 14 and 2015 S&C Readers' Choice Awards.

AXIOM Business Books Awards, bronze medal.

Stocks Technical Analysis Basics Part 4
Support Lines and Resistance Lines
Support and Resistance at turning points
Prices move in waves. This undulating price picture with tops and bottoms occurs because, at a certain level, the price experiences support or resistance. At a bottom, the price is supported by sufficient buyers, and it bounces up again. At a top, the price is pushed down by large selling pressures.
Special offer: "Capturing Profit with technical Analysis"
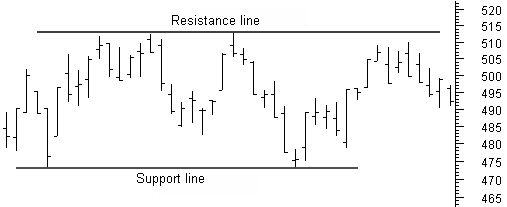
Figure 4.10: Basic support and resistance.
The price level of a share has everything to do with supply and demand (figure 4.10) forming the resistance lines and support lines. For a given increase in price, there are a number of buyers and sellers. A price increase will attract more sellers, but the number of buyers will decrease. A resistance line forms at a balance in sellers and buyers.
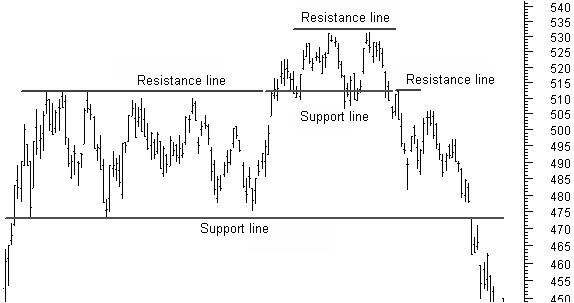
Figure 4.11: Resistance becomes support.
A broken resistance line automatically becomes a support line for future price levels (figure 4.11). Horizontal support lines and resistance lines are drawn through turning points in price or a price window. A confirmation is given if the price turns against this line.
A support or resistance line is broken if crossed with the closing price.
Technical Analysis basics NEXT -Previous -Part 1 -Part 2 -Part 3 -Part 4 -Part 5
STOCATA Stocks Technical Analysis HOME
Links
Find a Stock ticker symbol, enter the ticker and find a chart, news, fundamentals and historical quotes.
Risk Disclosure: Futures and forex trading contains substantial risk and is not for every investor. An investor could potentially lose all or more than the initial investment. Risk capital is money that can be lost without jeopardizing ones’ financial security or life style. Only risk capital should be used for trading and only those with sufficient risk capital should consider trading. Past performance is not necessarily indicative of future results.
Hypothetical Performance Disclosure: Hypothetical performance results have many inherent limitations, some of which are described below. no representation is being made that any account will or is likely to achieve profits or losses similar to those shown; in fact, there are frequently sharp differences between hypothetical performance results and the actual results subsequently achieved by any particular trading program. One of the limitations of hypothetical performance results is that they are generally prepared with the benefit of hindsight. In addition, hypothetical trading does not involve financial risk, and no hypothetical trading record can completely account for the impact of financial risk of actual trading. for example, the ability to withstand losses or to adhere to a particular trading program in spite of trading losses are material points which can also adversely affect actual trading results. There are numerous other factors related to the markets in general or to the implementation of any specific trading program which cannot be fully accounted for in the preparation of hypothetical performance results and all which can adversely affect trading results.
See more 'Legal Disclosures' in the bottom menu bar!