
Latest News
2022 Start working on a new website
BBS Trading Expert
Watch the Youtube BBS video and here is a crude oil trading example
Want to know more about:
AXIOM business books awards, bronze medal! Thank You!
No longer available!
Favorite articles in 2010, 11, 12, 14 and 2015 S&C Readers' Choice Awards.

AXIOM Business Books Awards, bronze medal.

Stocks Technical Analysis Basics Part 5
Windows Support and Resistance
We talk about a rising window if the lowest price today is higher than the highest price of yesterday, while a falling window occurs if the highest price today is lower than the lowest price of yesterday.
Special offer: "Capturing Profit with technical Analysis"
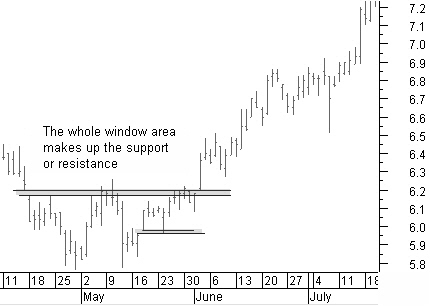
Figure 4.12: Windows resistance and support levels.
In figure 4.12, look at how windows constitute important support and resistance levels. The entire area of a window represents support or resistance. The support or resistance of a window is broken only if crossed with the closing price.
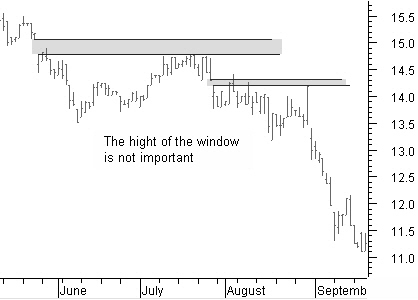
The height of the window has no importance (figure 4.13).
REMARK: It can be worthwhile to pass on support or resistance from a lower time frame like, for example, an hourly price chart to a chart with daily prices (or visa versa).
A certain support or resistance area is possibly a window in the hourly price chart, but it is not visible on the daily chart.
Figure 4.13: The height of the window is not important.
Confirmation of Support and Resistance
Turning points at a support or resistance level often are confirmed by candlestick reversal patterns.
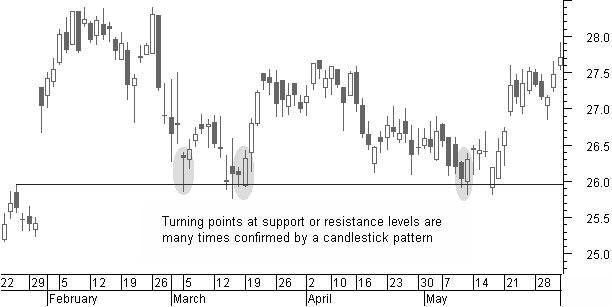
Figure 4.14: Support and resistance confirmation.
In the chart in figure 4.14, notice the first reversal with a hammer pattern and the next two reversals with engulfing bullish patterns.
Technical Analysis basics PREVIOUS -Part 1 -Part 2 -Part 3 -Part 4 -Part 5
STOCATA Stocks Technical Analysis HOME
Links
Find a Stock ticker symbol, enter the ticker and find a chart, news, fundamentals and historical quotes.
Risk Disclosure: Futures and forex trading contains substantial risk and is not for every investor. An investor could potentially lose all or more than the initial investment. Risk capital is money that can be lost without jeopardizing ones’ financial security or life style. Only risk capital should be used for trading and only those with sufficient risk capital should consider trading. Past performance is not necessarily indicative of future results.
Hypothetical Performance Disclosure: Hypothetical performance results have many inherent limitations, some of which are described below. no representation is being made that any account will or is likely to achieve profits or losses similar to those shown; in fact, there are frequently sharp differences between hypothetical performance results and the actual results subsequently achieved by any particular trading program. One of the limitations of hypothetical performance results is that they are generally prepared with the benefit of hindsight. In addition, hypothetical trading does not involve financial risk, and no hypothetical trading record can completely account for the impact of financial risk of actual trading. for example, the ability to withstand losses or to adhere to a particular trading program in spite of trading losses are material points which can also adversely affect actual trading results. There are numerous other factors related to the markets in general or to the implementation of any specific trading program which cannot be fully accounted for in the preparation of hypothetical performance results and all which can adversely affect trading results.
See more 'Legal Disclosures' in the bottom menu bar!