
Latest News
2022 Start working on a new website
BBS Trading Expert
Watch the Youtube BBS video and here is a crude oil trading example
Want to know more about:
AXIOM business books awards, bronze medal! Thank You!
No longer available!
Favorite articles in 2010, 11, 12, 14 and 2015 S&C Readers' Choice Awards.

AXIOM Business Books Awards, bronze medal.

Money and Risk management Part 2
Limited Stock Selection
A second money-management possibility is to select a limited number of stocks for trading. I prefer this method because it is much easier to follow-up a limited number of stocks with technical analysis techniques.
With a fixed, limited number of stocks, it is possible to keep individual charts with specific notes over longer periods of time.
Special offer: "Capturing Profit with technical Analysis"
We can start with a fixed capital per stock. Assuming a starting capital of $25,000, we could divide this money over 20 stocks, each of which gets a starting capital of $1,250.
Each of the 20 stocks is traded individually, with no profit or loss sharing. All profits or losses are attributed to the individual stock. This means, of course, that each stock must be followed individually because it can only use its own private capital.
Applying this kind of money management is effective and has a number of advantages:
- With a starting capital of $25,000 and a spread between 20 stocks, each with $1,250, the total loss of one stock only creates a loss of 5% in the total portfolio.
- A stock doing well will generate maximum profits, thereby re-investing all profits.
- A stock producing bad results will have less capital to spend, thereby limiting losses when things continue to go the wrong way.
- The profits of a stock doing well are not lost when they are invested in stocks not doing that well.
Poorly performing stocks will be recognized more quickly, which means that they can be replaced much faster. In the worst case scenario, the stocks will not be in the race anymore because there is no more capital left.
Spreading the capital among a sufficient number of stocks will improve the end result because some stocks will be doing much better than the average.
To find the results using a portfolio with or without profit and loss sharing, we can run a test with the same stocks over the same period and with the same buying, selling, and cost of trade conditions.
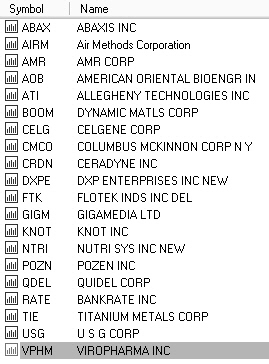
In figure 10.1, we are using a list of stocks with daily prices over a six-year period dating back from the end of September 2008.
I used one of my automatic expert buy-and-sell test systems. Although the system used is not necessarily important, it is important to use the same system test under the same circumstances and during the same time period. In this example, we only took long positions. For the first test, we have a starting capital of $25,000 to be divided between the 20 stocks. But there is profit and loss sharing, so each stock will get 5% of the portfolio value at any moment in time.
Figure 10.1: List of stocks used for testing.
The Result with Profit and Loss Sharing
There was an average of 25 trades per stock in the total time period.
The total profit is $128,872.
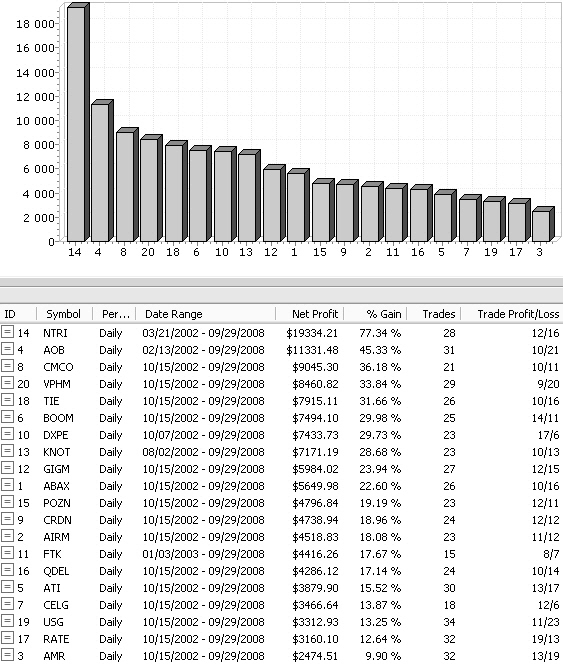
Figure 10.2: Test result with profit and loss sharing.
ATTENTION The %Gain indication in the result table (figure 10.2) is the profit percentage compared to the total capital!
The Result without Profit and Loss sharing
There were, on average, 25 trades per stock during the entire period.
The total profit is $265,356.
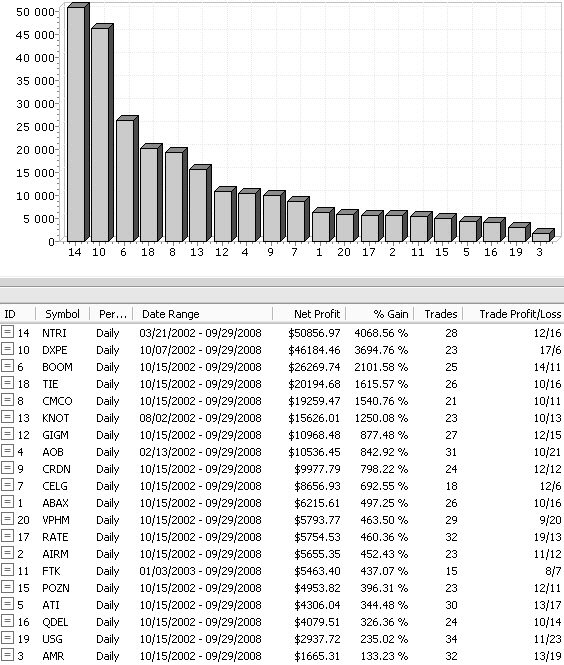
Figure 10.3: Test result without profit and loss sharing.
ATTENTION: The %Gain indication in the results table (figure 10.3) is in relation to the starting capital of each stock ($1,250).
The final profit has more than doubled.
Trading a selected, limited number of stocks and not sharing profits or losses is the better choice!
For trading stocks I strongly advice to divide your capital between a limited fixed number of stocks, not sharing any individual loss or profit between these stocks. So, you will have to do an individual follow-up of profit and loss for each stock.
Money & Risk management next -Previous -Part 1 -Part 2 -Part 3 -Part 4 -Part 5 -Part 6
STOCATA Stocks Technical Analysis HOME
Links
Find a Stock ticker symbol, enter the ticker and find a chart, news, fundamentals and historical quotes.
Risk Disclosure: Futures and forex trading contains substantial risk and is not for every investor. An investor could potentially lose all or more than the initial investment. Risk capital is money that can be lost without jeopardizing ones’ financial security or life style. Only risk capital should be used for trading and only those with sufficient risk capital should consider trading. Past performance is not necessarily indicative of future results.
Hypothetical Performance Disclosure: Hypothetical performance results have many inherent limitations, some of which are described below. no representation is being made that any account will or is likely to achieve profits or losses similar to those shown; in fact, there are frequently sharp differences between hypothetical performance results and the actual results subsequently achieved by any particular trading program. One of the limitations of hypothetical performance results is that they are generally prepared with the benefit of hindsight. In addition, hypothetical trading does not involve financial risk, and no hypothetical trading record can completely account for the impact of financial risk of actual trading. for example, the ability to withstand losses or to adhere to a particular trading program in spite of trading losses are material points which can also adversely affect actual trading results. There are numerous other factors related to the markets in general or to the implementation of any specific trading program which cannot be fully accounted for in the preparation of hypothetical performance results and all which can adversely affect trading results.
See more 'Legal Disclosures' in the bottom menu bar!