
Latest News
2022 Start working on a new website
BBS Trading Expert
Watch the Youtube BBS video and here is a crude oil trading example
Want to know more about:
AXIOM business books awards, bronze medal! Thank You!
No longer available!
Favorite articles in 2010, 11, 12, 14 and 2015 S&C Readers' Choice Awards.

AXIOM Business Books Awards, bronze medal.

Money and Risk management Part 6
Stock Insurance Policy
Besides using money management, trailing stops and initial stops with a good risk to reward ratio, you could use stock options to limit losses right from the start.
If you really want to know beforehand your maximum loss when trading stocks, you can have an insurance policy using stock options.
Special offer: "Capturing Profit with technical Analysis"
General Tire & Rubber Co.
Let’s use GT as an example. And let’s assume a total capital of $30,000, investing in a minimum of 10 different stocks for spreading the risk.
We then have a starting amount of $3,000 per stock. We allow a 10% loss from the start, or as a trailing stop, we want to catch the bigger moves of this stock. This means a loss of $300 in one trade.
This limits the loss to 1% in relation to the total investment capital, complying with good money management.
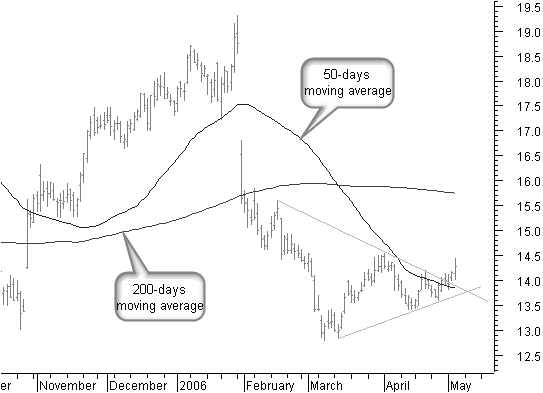
Figure 10.18: Stock insurance policy example with GT.
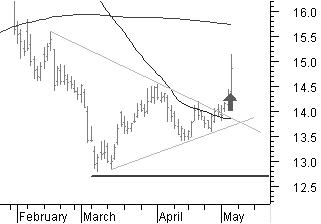
Figure 10.19: Buying GT at the next day opening price.
5/04/2006: GT moves above a descending trend line in figure 10.18, after a bottom was reached. The price is making a new up-move with higher bottoms. The stock price also is above the 50-day simple moving average. We buy GT at the opening price the next day (figure 10.19).
Buying the Stock
First we look at the scenario without options.
We invest $2,890 buying 200 pieces of GT on May 4 at the opening price of $14.45.
We will allow a maximum loss from the start until just below the lowest point from the beginning of March.
This is a stop at $12.70, or a possible loss of $1.75, or 12%.
Insurance with Put Options
In this scenario, we do not use a stop loss, but we are going to limit the possible loss by covering the position with Put options.
For all theoretical option calculations using the Black and Scholes model, let’s assume a volatility of 25%, an interest rate of 5%, and an expiration date of January 2007. With an exercise price of $14, we will pay $0.80 for this option. We are buying two contracts to cover the 200 shares of GT that we bought.
The total cost for these two Put contracts is $160.
We now own the right to sell 200 shares of GT at a price of $14 until the third Friday in January 2007. At worst, the total possible loss will be 14.45 -14 = 0.45 + 0.80 = $1.25, or a 9% loss. Our total investment is $3,050.
Price Drops Below Support
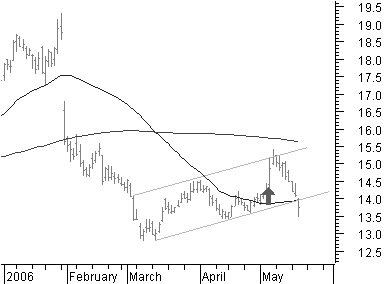
Figure 10.20: Price hits resistance and fails to break the moving average.
The stock price hits resistance and fails to break the 200-day simple moving average (figure 10.20); it drops below the ascending trend line out of the ascending price channel and below the 50-day simple moving average.
Looking at the short term, there is a big chance that the stock price will move down farther.
Writing Covered Call Options
This is an opportunity to win back part of our insurance money. Let’s write a couple of covered Call options. At the stock price of $13.74 on May 17, we write two Call options with an expiration of July 2006 and with an exercise price of $14. This brings in $110 and pays back part of the cost of the Put options we bought as insurance, at least if all goes as expected.
>Possible Result
The bad scenario: The stock price rises short term to $15, for example. We may be exercised and have to deliver the stock. Closing this transaction will give the following result: stock value $3,000 + actual value of the Put option $120 - the actual value of the written Call options is $280, for a total of $2,840, or a loss of $210. If the stock price moves above the exercise price of the written Calls, it clearly is better to close the position or, in any case, buy back the Calls; otherwise, if the stock price keeps moving up, the invested capital is blocked.
The good scenario: The stock price drops to $12.50, for example.
Your protection with the Put options at 14 is unchanged. The written Call options now have a value of only $0.30. You can buy them back and make a net profit of $80.
Writing these Call options is an opportunity, but you do not have to do it. It generally will not change much at the final result.
Price Drops Below the Stop Loss
Without the Put options insurance, you must sell GT at a value of $12.54 on May 31 (figure 10.21).
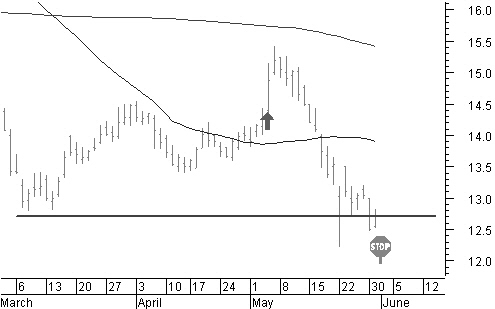
Figure 10.21: Price drops below the stop loss.
The stock price drops below the stop loss; this would create a loss of:
buying cost -$2,890 + selling $2,508 = -$382, or a loss of -13.2%.
Forced to Sell After a Big Move Down?
What would the result be with the Put option insurance when you have to close the trade after a big move down because you need the money?
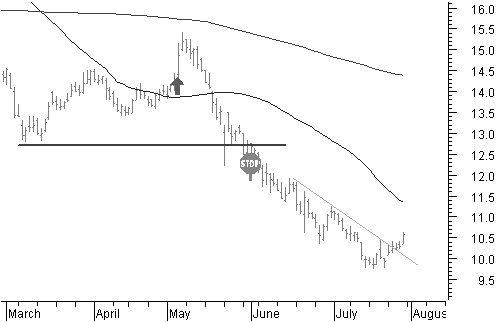
Figure 10.22: Forced to sell after a big move down?
On July 28, the stock price is at $10.57 in figure 10.22. The price is close to the lowest low point.
If, for any reason, you had to close the position now, what would the result be?
Be warned that without the Put options, holding on to your position because you do not like to take losses or because you believe that what comes down must go up again will create a very unhealthy situation.
A loss of:
buying cost -$2,890 + selling $1,943 = -$947, or a loss of -32.7%. This is very bad money and risk management; something you cannot permit yourself many times!
Things look a lot better when covered by the Put options insurance.
A loss of:
buying the stock -$2,890 – cost Put options -$160 + selling the stock $2,114 + selling the Put options $640 = -$296, or a loss of -10.2%.
If you had made the $80 writing the Calls, your loss would be limited to:
-$216, or -7.4%. That is a big difference with the loss of -32.7%, not having the options insurance policy.
Making Extra Profit Buying Call Options
On August 28, the stock price moves above a resistance line and is already moving for some time above the 50-day simple moving average.
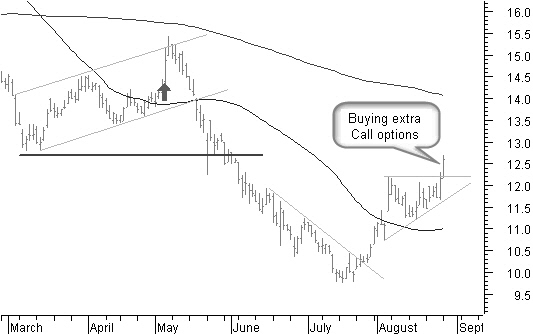
Figure 10.23: Making extra profit buying call options.
In figure 10.23, you can see how the price breaks out of an ascending triangle.
This is a continuation pattern for a farther price up-move.
It looks like a new uptrend is on the way, some three months later than first imagined when the stock was bought.
Taking a small extra risk possibly can bring nice extra profits, if the price keeps going up.
We buy an extra pair of out-of-the-money Call options.
At a stock price of $12.60, we buy two Call contracts with an expiration date of January 2007 (the same expiration date as the Put options we bought as insurance) and an exercise price of $14.
This costs only $80.
Closing the Position, November 30
After a price top of around $19 (figure 10.24), the price falls back and we might decide to take profit.
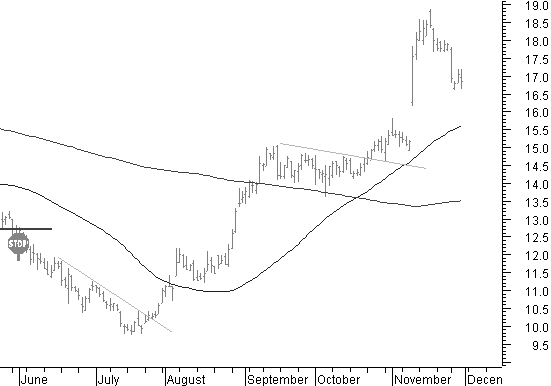
Figure 10.24: Taking profit, closing the position.
On November 30, the stock price is at $16.85.
Without the extra Call options the profit is:
selling the stock $3,370 – buying cost $2,890 – cost of the Put options -$160 = $320, or 11%. Do not forget that we had more than a 30% drawback in between.
With the extra Call options, we make a profit of:
selling the stock $3,370 + selling the Call options $600 – buying the stock -$2,890 – buying the Put options -$160 – buying the Call options -$80 = $840, or 29%.
The Result at Expiration Date
With the Put options, you are covered until January 19, 2007.
Also, the Call options expire on the same date. If the price remains above support and above the 50-day simple moving average, it could be worth waiting for more profit.
Another possibility would be to fix the profit, close the positions, and invest part of the profit in new longer-term Call options.
That way, you continue to profit if the price continues its way up.
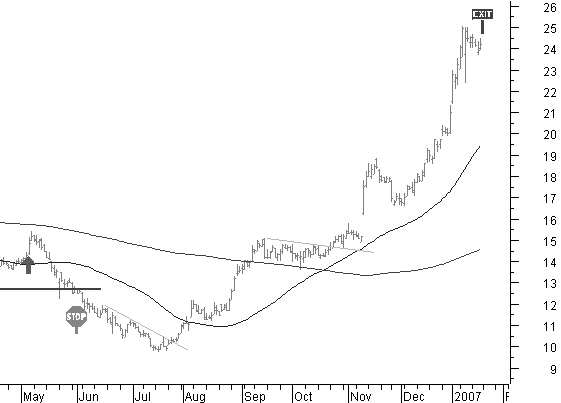
Figure 10.25: The result at expiration date.
On January 19, in figure 10.25, the stock price is at $24.22.
The result without the extra Call options is $4,844 - $160 = $4,684, or 53% profit.
The result with the extra Call options is: selling the stock $4,844 + selling the Call options $2,000 –cost Put options $160 – cost Call options $80 = $6,604, or a profit of 117%.
Money & Risk management PREVIOUS -Part 1 -Part 2 -Part 3 -Part 4 -Part 5 -Part 6
STOCATA Stocks Technical Analysis HOME
Links
Find a Stock ticker symbol, enter the ticker and find a chart, news, fundamentals and historical quotes.
Risk Disclosure: Futures and forex trading contains substantial risk and is not for every investor. An investor could potentially lose all or more than the initial investment. Risk capital is money that can be lost without jeopardizing ones’ financial security or life style. Only risk capital should be used for trading and only those with sufficient risk capital should consider trading. Past performance is not necessarily indicative of future results.
Hypothetical Performance Disclosure: Hypothetical performance results have many inherent limitations, some of which are described below. no representation is being made that any account will or is likely to achieve profits or losses similar to those shown; in fact, there are frequently sharp differences between hypothetical performance results and the actual results subsequently achieved by any particular trading program. One of the limitations of hypothetical performance results is that they are generally prepared with the benefit of hindsight. In addition, hypothetical trading does not involve financial risk, and no hypothetical trading record can completely account for the impact of financial risk of actual trading. for example, the ability to withstand losses or to adhere to a particular trading program in spite of trading losses are material points which can also adversely affect actual trading results. There are numerous other factors related to the markets in general or to the implementation of any specific trading program which cannot be fully accounted for in the preparation of hypothetical performance results and all which can adversely affect trading results.
See more 'Legal Disclosures' in the bottom menu bar!