
Latest News
2022 Start working on a new website
BBS Trading Expert
Watch the Youtube BBS video and here is a crude oil trading example
Want to know more about:
AXIOM business books awards, bronze medal! Thank You!
No longer available!
Favorite articles in 2010, 11, 12, 14 and 2015 S&C Readers' Choice Awards.

AXIOM Business Books Awards, bronze medal.

Money and Risk management Part 5
Risk-to-Reward Ratio
The risk method includes the money management method and manages risk by using an initial and trailing stop. The initial stop should be such that we always at minimum have a risk to reward ratio of 1 to 3.
Special offer: "Capturing Profit with technical Analysis"
Limiting the possible loss in a trade is probably the most important factor when considering a new position. Assume that of all trades, 50% are winning trades and 50% are losing trades. With an average loss of 15%, we would have to make an average profit of 25% on winning trades to end up with a final profit of only 10%. Don’t forget that a 25% up-move in a stock is already a big move. It will not be easy to make profits!
If, on the other hand, we suffer a loss of only 5% on a losing trade, we would have to make a limited 15% profit on winning trades to end up with a 10% profit. This is much easier, since smaller moves are more common. At the opening of a position, the risk-to-reward ratio should be a minimum of one to three.
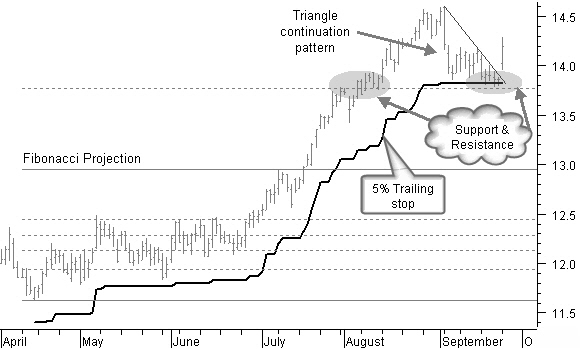
Figure 10.12: Centerpoint Energy Inc breaking out of triangle correction pattern.
The up-move in the Centerpoint Energy Inc. chart of figure 10.12 is slowing down during the month of September. The correction made a triangle continuation chart pattern, with a breakout to the upper side. At the same time, the price is finding support at the level of the first Fibonacci target projection (161.8%) and at a 5% trailing stop level, in use since the beginning of the up-move.
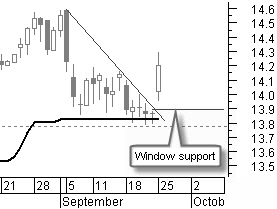
Figure 10.13: Centerpoint Energy Inc detailed candlestick view.
The detailed candlestick chart in figure 10.13 confirms the support of a doji at the beginning of September and is further confirmed with a number of doji’s and with the support of a window.
Now buying Centerpoint at a closing price of $14.20 allows us keeping a close stop at $13.90 at the low of the window support, followed by a lot more support just a fraction lower.
What are the Price Targets?
The next Fibonacci price target (see chapter 10 “Price Projections”) is at 261.8%, or $15.10. This also is the level of a previous top in the price chart (not shown). This target is sufficient to comply with the one to three risk-to-reward ratio.
If the window we have now is a continuation window in the uptrend, it would mean that we are only about halfway through the up-move, which means that the target will still be a lot higher.
Finally, there is the third Fibonacci target at 423.6%, or $17.20, that we should not exclude: It is a window out of the past (not shown) that has not yet been closed.
We can, therefore, consider this a favorable risk-to-reward ratio. We buy the stock with an initial stop at $13.8 or about 3% below our buying price, just below the last turning point, and we continue using the 5% trailing stop.
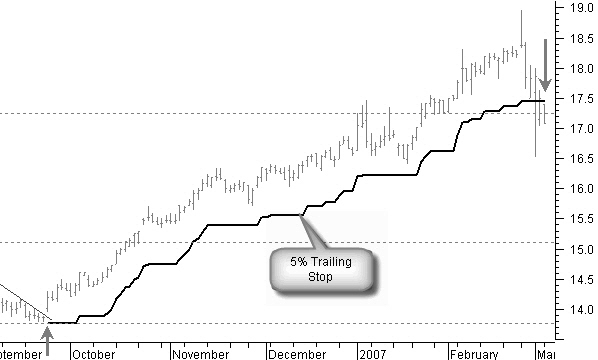
Figure 10.14: Centerpoint Energy Inc; very positive result.
If the move up continues, as is the case here (figure 10.14), we have an enormously positive risk-to-reward ratio. And, had the move turned out wrong, the risk would have been limited to a loss of about 3% only.
Even with just 40% winning trades and 60% losing trades, the end result will still be positive. This is why it is very important to apply good money- and risk-management techniques with every trade.
Gammon Lake Res Inc.: Buy Here?
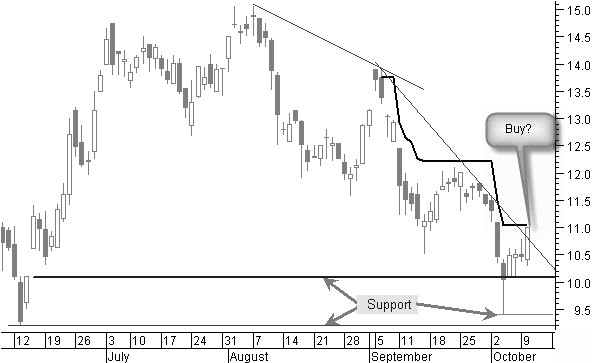
Figure 10.15: Gammon Lake Res Inc, buy here or?
In figure 10.15, the price has made a bigger correction and is now turning up and breaking the last steeper downtrend line. There probably is some support from a previous window, even if it has been broken recently, and support from a last and a previous turning point and from a hammer pattern in the candlestick chart at the same level as the window support. Basically, all of these are good technical reasons to open a trade.
What about the risk-to-reward ratio?
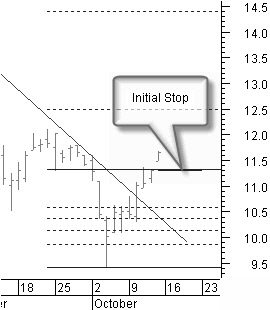 Buying at a price of about $11, we find a first support at around $10, some 10% lower. The trailing 10% stop that was used in the last descend appears to be a sensible stop with the actual price volatility. This stop is not yet broken by the new uptrend. The first price target is at $12, the last previous high. Next, there is the resistance of two windows at $12.50 and $13.
This rather high initial stop of 10% and the three resistance levels very close by give us a bad risk-to-reward ratio. The decision to take is not to buy!
Figure 10.16: Gammon Lake Res Inc three days later, a better buying moment.
Three days later (figure 10.16), Gammon Lake Res Inc. is still moving up.
We now have a window between the price of yesterday and today. This window gives support, together with a previous small bottom from the end of September. Buying now allows us to set a very close initial stop at about only 3%.
A Fibonacci projection from the low point and the start of the window, which also is the small previous low point in price that we can use to create a historical Fibonacci projection, gives price targets at $12.50 and $14.50. Buying here gives us a very good risk-to-reward ratio.
We are buying now!
Buying with the first signal would have given a fraction more profit. But the risk-to-reward ratio was really bad that moment in time!
We now have almost the same profit, but with an initial risk of only a 3% loss.
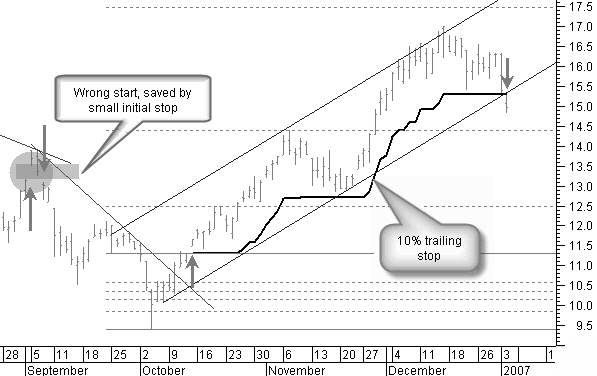
Figure 10.17: Gammon Lake Res Inc reaching the Fibonacci targets.
In figure 10.17, we reach the Fibonacci targets at $12.50 and $14.50. Even the next Fibonacci target at $17.50 came very close.
In the beginning of September, you could have made the decision buying this stock when the price started moving up with a window. Even the risk-to-reward ratio would have been acceptable. Unfortunately this would have been a losing trade.
Thanks to the close stop at the lower side of the window, you would have got out of the trade with only a small loss.
Of course, it makes no sense to systematically use a small initial stop of, for example, 3%. The stop level used must be supported by technical analysis.
Money & Risk management next -Previous -Part 1 -Part 2 -Part 3 -Part 4 -Part 5 -Part 6
STOCATA Stocks Technical Analysis HOME
Links
Find a Stock ticker symbol, enter the ticker and find a chart, news, fundamentals and historical quotes.
Risk Disclosure: Futures and forex trading contains substantial risk and is not for every investor. An investor could potentially lose all or more than the initial investment. Risk capital is money that can be lost without jeopardizing ones’ financial security or life style. Only risk capital should be used for trading and only those with sufficient risk capital should consider trading. Past performance is not necessarily indicative of future results.
Hypothetical Performance Disclosure: Hypothetical performance results have many inherent limitations, some of which are described below. no representation is being made that any account will or is likely to achieve profits or losses similar to those shown; in fact, there are frequently sharp differences between hypothetical performance results and the actual results subsequently achieved by any particular trading program. One of the limitations of hypothetical performance results is that they are generally prepared with the benefit of hindsight. In addition, hypothetical trading does not involve financial risk, and no hypothetical trading record can completely account for the impact of financial risk of actual trading. for example, the ability to withstand losses or to adhere to a particular trading program in spite of trading losses are material points which can also adversely affect actual trading results. There are numerous other factors related to the markets in general or to the implementation of any specific trading program which cannot be fully accounted for in the preparation of hypothetical performance results and all which can adversely affect trading results.
See more 'Legal Disclosures' in the bottom menu bar!