
Latest News
2022 Start working on a new website
BBS Trading Expert
Watch the Youtube BBS video and here is a crude oil trading example
Want to know more about:
AXIOM business books awards, bronze medal! Thank You!
No longer available!
Favorite articles in 2010, 11, 12, 14 and 2015 S&C Readers' Choice Awards.

AXIOM Business Books Awards, bronze medal.

Investing your Savings PART1
GOTO: part2 - part3 - part4 - part5- Special Techniques - HOME
With this presentation I want you to start thinking about investing your savings in the stock market. Not waiting until you have more free time, more savings or just waiting until your retirement. Because your best chance for success is that you are still young and therefore able to profit from a compounding investment strategy for the years to come. Compare the different possibilities.
Savings account
So, you have some savings, even limited amounts, what can you do?
First, to avoid the discussion what is a $1000 worth in 50 years from now, we can compare the dollar price change of gold. Based on the gold price evolution we can estimate an average price difference, taking out short term extremes, to a factor of 13 since the gold standard was abandoned in 1971.
That means a $1,000 must be worth $13,000 after 50 years for a comparable buying power.
An interest rate on a savings account of 3% net, compounded per year during 50 years would give only $4,384 or compared to the evolution of the gold price, you are losing 2/3 of the buying power of the original capital. You actually need about 5.3% net to compensate for this loss. A savings account is clearly not a good solution.
Buy and Hold Investing
In the following chart you can see that investing in the S&P500 index with a buy and hold strategy since 1960 the $1000 would now be worth around $20,000.
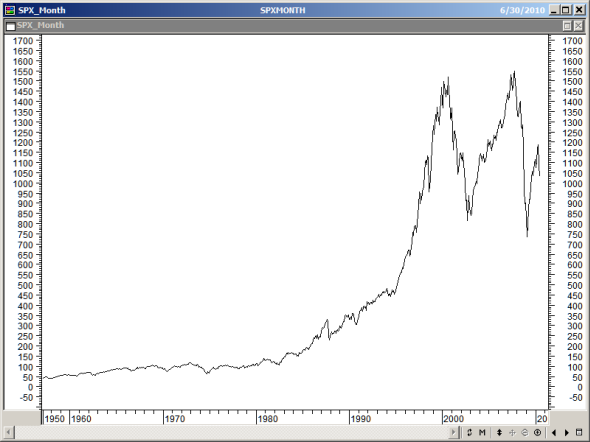
Compared to the dollar value change of gold ($13,000) you are making some profit. This looks like a better solution; unfortunately the result is very dependent of the time entering the market. Entering in 2000 or 2007 will badly influence your long term profit.
So, what we are looking for is a method realizing a better result with a high degree of confidence and with good money and risk management. What are the possibilities today and what should you be looking for?
Trading Techniques
1. Trade long and short
Nowadays you can trade short as easy as trading long. Trading long means buying a stock, making money when that stock rises selling it at a higher price. Trading short means selling a stock that you do not have in possession, making money when the stock price goes down buying back that stock at a lower price. Please keep in mind that it is much more difficult to make money trading short than long, simply because a stock can drop only 100%, but can rise principally unlimited.
2. Spread the Risk
Trading a single stock or bond of a company is dangerous. When that company goes broke, all your money is lost. Today it is possible to trade an index like the US Standard & Poor’s 500 index, representing 500 individual stocks, spreading the risk over 500 stocks. You can do this with so called ETF’s “Exchange Traded Funds”.
3. Compound the Profits
One of the most powerful money making tactics is compounding profits. It was Einstein who said that compounding interest was the world’s greatest invention. That means you must keep the money in your account and re-invest all of it the next trade.
4. Risk and Money management
To protect your account you must use some kind of risk management using stop loss settings or make sure that this risk management is built into your basic trading system. Eventually you must use a good money management method if you are trading more items in your portfolio. For example; do not risk more than 2% of your total portfolio value in one trade and do not risk more than 15% loss on the value of a single trade (depending of the underlying stock and the trading period).
5. Use a Professional and reliable Online Broker
Look for a reliable professional online broker. Look for low cost, a professional trading platform with the smallest spreads (difference between bid and ask price) and that they do not use or risk any of your money. Their income is purely coming from profit on the trading charges. Furthermore, every account must be insured by the US government up to $500,000 or up to any higher amount with additional (free of charge) insurance. You can find transaction cost trading stocks for less than $1 per transaction. Buying and selling must just be a mouse click away and should only take milliseconds.
6. Use a Margin Account for More Buying Power
You can, if you want to make use of the leverage offered by your broker, use a margin account. A 4 to 1 ratio allowing you to trade up to 4 times the amount of money in your account should be sufficient for trading stocks.
7. Use Technical Analysis Techniques
Trading can be done based on fundamental analysis of the market. However since fundamental data has a limited number of data points and is mostly lagging 3 to 6 months, it is not easy to trade based on fundamental data.
Trading based on technical (graphical) analysis is much faster as this analysis is mainly based on price and volume data. For that you will need of course a technical analysis program. Price and volume data is available in all time frames, tick data (every transaction), minutes, hours, days, weeks and months data. End of day data can be found on the Internet free of charge or charts and real time data can be included with your brokers’ account.
8. Back test your Trading method
There are many methods and indicators that can be used to help you make trading decisions. Question is to find and test a method on past data that proofs to be profitable, not exposing you to unacceptable drawdowns.
Ideally your buy and sell rules can be automated allowing you to back test results or even to let you trade full automatically; buy and sell orders are than generated and transmitted automatically to your broker.
If you are trading manually; try your method first on past historical data, advancing bar by bar and make sure you are capable of making consistent profits. Preferably you should do some paper trading before going for real trading.
Start real trading with only part of your capital; you will still need to learn to deal with your personality as a result of the effect of trading with your own hard earned savings!
Continue reading part2.
GOTO: part2 - part3 - part4 - part5 - Special Techniques - HOME
Links
Find a Stock ticker symbol, enter the ticker and find a chart, news, fundamentals and historical quotes.
Risk Disclosure: Futures and forex trading contains substantial risk and is not for every investor. An investor could potentially lose all or more than the initial investment. Risk capital is money that can be lost without jeopardizing ones’ financial security or life style. Only risk capital should be used for trading and only those with sufficient risk capital should consider trading. Past performance is not necessarily indicative of future results.
Hypothetical Performance Disclosure: Hypothetical performance results have many inherent limitations, some of which are described below. no representation is being made that any account will or is likely to achieve profits or losses similar to those shown; in fact, there are frequently sharp differences between hypothetical performance results and the actual results subsequently achieved by any particular trading program. One of the limitations of hypothetical performance results is that they are generally prepared with the benefit of hindsight. In addition, hypothetical trading does not involve financial risk, and no hypothetical trading record can completely account for the impact of financial risk of actual trading. for example, the ability to withstand losses or to adhere to a particular trading program in spite of trading losses are material points which can also adversely affect actual trading results. There are numerous other factors related to the markets in general or to the implementation of any specific trading program which cannot be fully accounted for in the preparation of hypothetical performance results and all which can adversely affect trading results.
See more 'Legal Disclosures' in the bottom menu bar!