
Latest News
2022 Start working on a new website
BBS Trading Expert
Watch the Youtube BBS video and here is a crude oil trading example
Want to know more about:
AXIOM business books awards, bronze medal! Thank You!
No longer available!
Favorite articles in 2010, 11, 12, 14 and 2015 S&C Readers' Choice Awards.

AXIOM Business Books Awards, bronze medal.

Investing your Savings PART3
GOTO: part1 - part2 - part4 - part5 - Special Techniques - HOME
With this presentation I want you to start thinking about investing your savings in the stock market. Not waiting until you have more free time, more savings or just waiting until your retirement. Because your best chance for success is that you are still young and therefore able to profit from a compounding investment strategy for the years to come. Compare the different possibilities.
Trading on a Daily Chart
If you have the possibility to follow up daily instead of a monthly basis, we can switch to a daily data chart.
The selected S&P500 trading period here is from October 2006 till November 2010, a period of 4 years. First we run a back test with SATS5 on the daily chart, not using any margin.
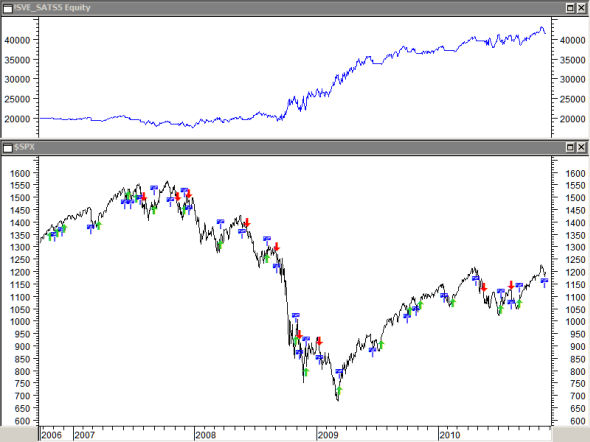
A buy and hold would suffer a loss of about 10%. SATS5 makes 28 trades of which 15 winning and 13 losing trades totaling a profit of 128%. That represents a compounding interest rate of 23% per year.
Now let’s take profit of using the margin account.
- The result with a 1.5 to 1 ratio with the same signals is 224%, almost double as much compared to not using any margin. Or a compounded interest rate of 33% per year.
- The result with a 2 to 1 ratio with the same signals is 350% or almost 3 times as much not using any margin. This amount gives you a compounded interest rate of 45% per year.
- The result with a 3 to 1 ratio with the same signals is 582% or almost 5 times as much not using any margin. This amount gives you a compounded interest rate of 60% per year.
- The result with a 4 to 1 ratio with the same signals is 1,120% or 9 times as much not using any margin. This amount gives you a compounded interest rate of 87% per year.
It is possible to use a margin up to 4 times your capital here because the drawback percentage suffered on a daily chart is much less than on a monthly chart. On the daily index chart this will be in the order of maximum 15% and most of the time much less.
A 4 to 1 ratio in this case seems to be about the absolute maximum risk you should take. Do not forget that when you get a margin call, most brokers will automatically close your trade!
Now imagine trading with a moderate 2 to 1 margin; making that 45% compounded interest rate per year and that you could repeat the same result over a period of 20 years?
A $10,000 today with a 45% compounded interest over 20 years gives an amount of $16,879,518. And in 50 years? It goes up to $1,170,577,337,166.
Trading a single Stock
Do I here you say that you are still not happy with that? Still want a bit more?
OK! If you are willing to accept the risk, you could look for a single stock instead of trading the S&P500 index tracker (SPY).
Using a stock like “US Steel Corp” ticker symbol “X”, you can make more profit simply because the percent price moves in the same time period, or the daily volatility for this kind of stock, are much larger than the index moves.
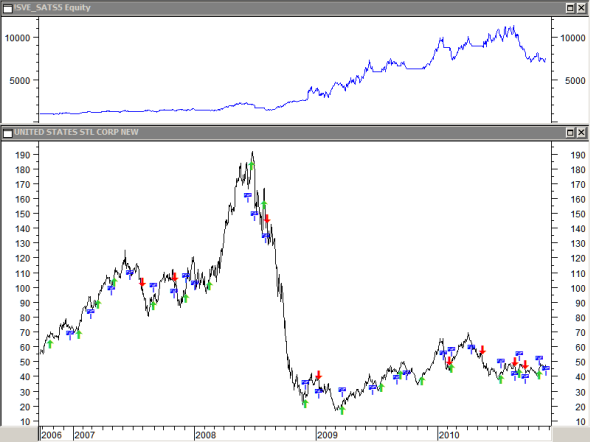
We use the same test period as before, from October 2006 till November 2010, a period of 4 years.
We run a back test with SATS5 on the daily chart, not using any margin. We start with just $1,000.
A buy and hold would suffer a loss of 14%. SATS5 makes 26 trades of which 19 winning and 7 losing trades totaling a profit of $6,397 or 640%. That represents a compounding interest rate of 65% per year.
Now let’s take profit of using the margin account.
The result with a 1.5 to 1 ratio with the same signals is $13,550 or 1,355%, more than double as much compared to not using any margin. Or a compounded interest rate of 95% per year.
The result with a 2 to 1 ratio with the same signals is $21,893 or 2,190% or almost 4 times as much not using any margin. This amount gives you a compounded interest rate of 118% per year.
The result with a 3 to 1 ratio with the same signals is $33,608 or 3,360% or more than 5 times as much not using any margin. This amount gives you a compounded interest rate of 142% per year.
The result with a 4 to 1 ratio is less good because of one big drawdown in June 2008.
Because drawdowns here are larger than the ones you will see in an index, the margin you can use will be limited to 2 or maximum 3 to 1. A large drawback here can be in the order of up to 25%. I would advise to use maximum a 2 to 1 ratio. Also make sure there is always sufficient margin and again do not forget that when you get a margin call, most brokers will automatically close your trade!
Can you imagine trading here with a 2 to 1 margin, making that 118% compounded interest rate per year and that you could repeat the same result over a period of 20 years?
A $10,000 today with a 118% compounded interest over 20 years gives an amount of $58,766,506,252.
And in 50 years? $837,191,249,264,135,000,000.
Maybe you can still read this? Anyway, all the stock markets in the world will be too small for you!
IMPORTANT!
My advice is NOT to trade just one single stock. If you prefer to trade single stocks, you must trade a minimum of 5 different well diversified stocks.
Continue reading part4.
GOTO: part1 - part2 - part4 - part5 - Special Techniques - HOME
Links
Find a Stock ticker symbol, enter the ticker and find a chart, news, fundamentals and historical quotes.
Risk Disclosure: Futures and forex trading contains substantial risk and is not for every investor. An investor could potentially lose all or more than the initial investment. Risk capital is money that can be lost without jeopardizing ones’ financial security or life style. Only risk capital should be used for trading and only those with sufficient risk capital should consider trading. Past performance is not necessarily indicative of future results.
Hypothetical Performance Disclosure: Hypothetical performance results have many inherent limitations, some of which are described below. no representation is being made that any account will or is likely to achieve profits or losses similar to those shown; in fact, there are frequently sharp differences between hypothetical performance results and the actual results subsequently achieved by any particular trading program. One of the limitations of hypothetical performance results is that they are generally prepared with the benefit of hindsight. In addition, hypothetical trading does not involve financial risk, and no hypothetical trading record can completely account for the impact of financial risk of actual trading. for example, the ability to withstand losses or to adhere to a particular trading program in spite of trading losses are material points which can also adversely affect actual trading results. There are numerous other factors related to the markets in general or to the implementation of any specific trading program which cannot be fully accounted for in the preparation of hypothetical performance results and all which can adversely affect trading results.
See more 'Legal Disclosures' in the bottom menu bar!